China Plus One Strategy: Why India Is the Smartest Manufacturing Bet in 2026

Introduction

Every CFO has heard the phrase “China Plus One”. Most have a slide in the board deck. Fewer have a qualified second source. The gap between strategic intent and operational reality is where supply chain risk lives. China+1 is not a trend – it is a structural shift driven by four converging forces: US-China trade tensions, pandemic-era supply chain fragility, ESG-driven supply chain transparency demands, and China’s own rising wages. India has emerged as the leading China+1 destination not by default but by deliberate policy, demographic advantage, and a manufacturing ecosystem that is maturing rapidly. This guide gives you the strategic rationale, the sector-by-sector fit assessment, the honest challenges, and a practical four-step implementation roadmap.

What Is China Plus One?

China Plus One (C+1) is a business strategy where companies diversify manufacturing operations by adding a second country to their supply chain rather than relying solely on China. The “plus one” is not a replacement – it is a risk hedge and a cost diversification play.

The strategy gained urgency after four shocks:

  1. US Section 301 tariffs (2018-2019): 25% duties on $250B+ of Chinese goods created immediate cost disadvantage for China-sourced products exported to the US.
  2. COVID-19 (2020): Factory shutdowns in Wuhan and Guangdong exposed single-geography concentration risk across every global supply chain simultaneously.
  3. Suez Canal blockage (2021): Six days of canal blockage disrupted 12% of global trade and exposed logistics concentration risk.
  4. Taiwan Strait tensions (2022-present): Semiconductor supply chain concentration in Taiwan forced board-level scenario planning across every electronics-dependent industry.

Why India – And Not Vietnam, Mexico, or Bangladesh?

Vietnam: Strong for garments, footwear, and simple electronics assembly. But Vietnam’s working-age population is 56 million – India’s is 940 million. Vietnam will run out of low-cost labour. India will not.

Mexico: Compelling for US nearshoring on logistics grounds. But Mexico’s manufacturing ecosystem is largely US-captive (automotive, aerospace Tier-1) and capacity is constrained. Mexico and India are not competing – they serve different buyer profiles.

Bangladesh: Dominant in garments, very limited in electronics or precision manufacturing. No credible play for complex industrial manufacturing.

India’s differentiated advantages:

  • Scale: 940M working-age population, 1.5M engineering graduates/year
  • Policy: PLI schemes (Rs 2 lakh crore), ECMS 2025 (Rs 22,919 Cr), India Semiconductor Mission (Rs 76,000 Cr)
  • Ecosystem: 5,400+ Zetwerk-network suppliers; Jabil, Flex, Foxconn, Tata Electronics all operating
  • Geopolitics: Democratic, rule-of-law, no Section 301 tariff exposure, strong US/EU relationships
  • Language: English-medium engineering education; no communication barrier

India’s Cost Advantage: The Numbers

Labour cost comparison (2026 estimates, including statutory benefits and PF):

Assembly Operator: China coastal $4.50-6.00/hr | India Tier-1 $1.20-1.80/hr | India Tier-2 $0.80-1.20/hr

CNC Machinist: China coastal $7.00-9.00/hr | India Tier-1 $2.50-3.50/hr | India Tier-2 $1.80-2.50/hr

Quality Inspector: China coastal $5.50-7.50/hr | India Tier-1 $2.00-2.80/hr | India Tier-2 $1.40-2.00/hr

India Tier-2 cities (Pune, Coimbatore, Hosur, Vadodara) deliver 60-75% labour cost savings over Chinese coastal manufacturing. Even against Chinese interior factories, India Tier-2 saves 40-55%.

Tariff advantage: US Section 301 tariffs on Chinese goods range from 7.5% to 145% depending on HTS code. India faces standard MFN rates (0-5%). For tariff-impacted categories, India’s effective cost advantage can reach 20-30 percentage points.

Sector-by-Sector India Fit Assessment

Electronics / EMS – High Fit

Apple’s iPhone 14, 15, and 16 are assembled in India. Foxconn, Tata Electronics, Pegatron all operate India EMS plants. Samsung’s Noida facility is the world’s largest mobile phone factory by volume. India’s PLI smartphone scheme has created a credible EMS ecosystem that handles SMT assembly, systems integration, and product testing to IPC-A-610 Class 2/3 standards.

Automotive Components – High Fit

India is the world’s 3rd-largest automobile market and exports $21.2B in auto components (2023-24). IATF 16949-certified suppliers cover forging, casting, stamping, machining, plastics, and electronics across Pune, Chennai, and Gurugram clusters.

Aerospace Structures – Medium-High Fit

Bangalore’s KIADB Aerospace Park hosts Airbus, Boeing, Safran, and Honeywell. Tata Advanced Systems produces Airbus H125 helicopter structures and C-295 airframes. India’s offset obligation policy (35% indigenous content on defence contracts above Rs 300 Cr) creates captive demand.

Industrial Manufacturing – High Fit

Precision machined components, fabricated structures, forgings, castings, pumps, and compressors from India supply European and US industrial OEMs at 30-40% lower cost. Clusters in Pune, Coimbatore, Rajkot, and Ludhiana are established and export-oriented.

Pharmaceuticals – High Fit

India is already the world’s third-largest pharmaceutical producer by volume. With 3,000+ FDA-approved facilities and deep generics expertise, shifting API sourcing and formulation manufacturing to Indian CMOs is low-risk and high-reward.

Semiconductors – Developing (High Potential)

India Semiconductor Mission (Rs 76,000 Cr) has attracted Micron, Tata Electronics, and CG Power. OSAT facilities coming online 2026-2027; full-stack fab is a 5-7 year story.

Honest Challenges to Plan For

1. Component Ecosystem Depth

China’s component supply chain is unmatched – resistors, capacitors, connectors, PCB substrates are available within hours. In India, most components are still imported, adding 4-8 weeks to BOM lead times for electronics. Mitigant: use India for assembly-heavy, component-light products first while the ecosystem matures.

2. Logistics Infrastructure

Port dwell times at JNPT average 3-4 days vs 1 day at Shenzhen Yantian. Dedicated freight corridors (Delhi-Mumbai Industrial Corridor, Chennai-Bengaluru Corridor) are operational and improving. Mitigant: use bonded warehousing and dedicated logistics corridors.

3. Skilled Labour at Scale

India has 1.5M engineering graduates per year but hands-on manufacturing talent (CNC operators, SMT line technicians) is thinner. Mitigant: partner with manufacturers that have existing trained workforces rather than trying greenfield.

4. Regulatory Timelines

Factory approvals can take 6-18 months for greenfield. Mitigant: use contract manufacturers (like Zetwerk’s 5,400-supplier network) that absorb regulatory overhead.

5. Power Reliability

Uninterrupted power remains patchy outside industrial parks. Mitigant: specify industrial zones with captive power guarantees in RFQs.

How to Implement China+1 in India: A Practical Roadmap

Step 1 – Segment Your BOM (Weeks 1-4)

Not every component should move. Rank by: China supply concentration risk x lead time criticality x India capability readiness. Start with high-risk, India-ready items.

Step 2 – Identify Qualified Suppliers (Weeks 4-12)

Issue RFQs to vetted Indian contract manufacturers. Require: ISO 9001 as baseline, IATF 16949 or AS9100 for automotive/aerospace, factory audits with PPAP/FAI requirements. Platforms like Zetwerk aggregate pre-qualified suppliers with capability data, reducing discovery time from months to weeks.

Step 3 – Run Parallel Production (Months 3-9)

Overlap India ramp with China production. Validate quality through IPC-A-610 or equivalent inspections, DfM reviews, and first article inspection (FAI) sign-off before cutting China volumes.

Step 4 – Scale and Localise (Month 9+)

Once quality is validated, shift volume. Invest in localising the BOM – work with your Indian CM to identify Indian-sourced component substitutes to reduce import dependency and unlock PLI benefits.

Key Takeaways

  • China+1 is now structural, not optional – trade policy, ESG, and supply chain resilience are converging forces.
  • India is the leading China+1 destination for labour-intensive manufacturing, precision engineering, electronics EMS, and pharmaceuticals.
  • The cost advantage is real: 30-40% savings in direct labour over Chinese coastal manufacturing.
  • Government policy (PLI, ECMS 2025, India Semiconductor Mission) is materially de-risking the transition.
  • Challenges exist in component ecosystems and logistics – plan for them rather than be surprised.
  • The fastest path to India manufacturing is through an established contract manufacturing platform, not greenfield entry.

FAQ

Q: Is China+1 really necessary if my China supply chain is working fine?

A: A supply chain that “works fine” today was stress-tested in 2020, 2022, and 2024. The question is not whether disruption will happen again but whether your supply chain can absorb it. Diversification is insurance – the cost is low, the downside protection is significant.

Q: Does India have the manufacturing quality to match China?

A: For the sectors covered above – yes, with the right supplier selection. India’s top-tier CMs hold AS9100, IATF 16949, and IPC-A-610 certifications and supply to Boeing, Apple, and global automotive OEMs. Quality is a supplier-selection question, not a country-level question.

Q: How long does it take to qualify an Indian supplier?

A: For a standard industrial product: 3-6 months from RFQ to production-ready qualification including DfM, tooling, first article inspection, and PPAP. For aerospace/defence: 12-18 months. Electronics EMS with mature BOM: 2-4 months.

Q: What is the minimum order size that makes India viable?

A: There is no hard minimum. Economically, India contract manufacturing becomes compelling at annual spend above ~$250K per part family where labour intensity is high.

Q: Can I manage Indian manufacturing remotely?

A: Yes – with the right partner. Platforms with digital order management, real-time production tracking, and integrated quality reporting allow remote oversight. On-site visits are recommended at qualification stage; ongoing production can be managed digitally.

Additive Manufacturing vs Traditional Manufacturing: When 3D Printing Makes Economic Sense in 2026

Introduction

Additive manufacturing (AM) has moved beyond prototyping. In 2026, production-volume metal AM is used for aerospace brackets, surgical implants, heat exchangers, and complex fluid manifolds. Polymer AM is used for end-use tooling jigs, custom assembly aids, and low-volume functional parts. The question is no longer “can 3D printing make this part?” but “should 3D printing make this part – and at what volume does the economics flip to traditional manufacturing?”

This guide gives engineers and procurement teams a systematic framework for the AM vs traditional manufacturing decision, with cost crossover data, application fit analysis, and India sourcing context for both paths.

Additive Manufacturing Processes in 2026: The Landscape

Metal AM

DMLS/SLM (Direct Metal Laser Sintering / Selective Laser Melting): Laser powder bed fusion (LPBF) – the dominant metal AM process for structural parts. Materials: Ti-6Al-4V, Inconel 718, AlSi10Mg, 316L stainless, cobalt-chrome, copper alloys. Achievable tolerance: +/- 0.05-0.1mm. Surface finish: Ra 5-15 micron as-built (requires post-processing for precision surfaces).

DED (Directed Energy Deposition): Wire or powder-fed AM for large structural parts and repair. Lower resolution than LPBF but higher deposition rates and larger part capability. Used for aerospace structural repairs and large titanium components.

Binder Jetting: Metal binder jetting (Desktop Metal, ExOne) offers high throughput at lower cost than LPBF. Achievable porosity: below 99.5% density after sintering. Growing adoption for automotive and industrial production.

Polymer AM

FDM/FFF: The most widely used polymer AM process. Engineering materials: PC, Nylon, ULTEM, CF-Nylon. Suitable for jigs, fixtures, tooling inserts, low-load functional parts. Not suitable for precision-critical or high-surface-finish applications.

SLA / MSLA: Photopolymer resin printing. High resolution (25-50 micron layer), excellent surface finish. Suitable for complex enclosures, anatomical models, casting patterns. Limited material strength vs FDM for functional applications.

MJF / SLS: Nylon powder bed processes. Near-isotropic mechanical properties, good feature resolution, no support structures required. Increasingly used for end-use parts in automotive, consumer, and industrial applications.

The Economics: When AM Beats Traditional Manufacturing

Low Volume (Below ~50 Units) – AM Almost Always Wins

Below approximately 50 units, the tooling amortisation cost of traditional manufacturing (injection moulding: $5,000-50,000; investment casting: $3,000-30,000; CNC fixturing: $1,000-10,000) dominates unit economics. AM has zero tooling cost – you pay only for material and machine time. For 1-50 units, AM delivers functional parts in 2-5 days vs 4-12 weeks for traditionally manufactured equivalents.

Medium Volume (50-500 Units) – AM Competes Depending on Geometry

In the 50-500 unit range, AM competes when the part geometry justifies it: complex internal channels impossible in casting/machining, topology-optimised structures that cannot be manufactured traditionally, or when multiple traditionally-manufactured parts can be consolidated into one AM part (reducing assembly cost and weight).

Cost crossover example for a complex titanium bracket (aerospace): Traditional machining from billet at 500 units: $280/part (includes fixturing, 5-axis machining time, scrap). LPBF AM at 500 units: $380/part. Traditional wins on unit cost but loses on design freedom.

High Volume (Above 500 Units) – Traditional Manufacturing Wins on Cost

For volumes above 500 units, traditional manufacturing (CNC machining, investment casting, injection moulding) wins on cost in most cases. The exception is parts where AM’s geometric freedom enables:

  • Part consolidation: 8 machined parts consolidated into 1 AM part; traditional manufacturing at “8 parts x $40 each + assembly labour” vs AM at “1 part x $180” – AM wins on system cost despite higher part cost.
  • Performance-driven design: Topology-optimised structural parts where AM’s lighter weight justifies premium cost (aerospace, performance automotive).
  • Mass customisation: Medical implants (patient-specific orthopaedic), dental prosthetics, customised industrial tooling – each unit is unique, making traditional tooling impossible.

The AM vs Traditional Decision Framework

Step 1: Volume Check

Below 50 units: default to AM unless material is not AM-compatible. 50-500 units: evaluate based on geometry, weight sensitivity, and part consolidation opportunity. Above 500 units: default to traditional manufacturing unless a specific AM advantage exists.

Step 2: Geometry Check

Does the part have: internal lattice structures or conformal cooling channels (impossible in casting/machining)? Extreme undercuts or internal features inaccessible to machining tools? Weight reduction through topology optimisation that traditional manufacturing cannot achieve? If yes to any: AM warrants serious evaluation regardless of volume.

Step 3: Material Check

Is the required material processable by AM? Titanium Ti-6Al-4V: excellent LPBF results, close to wrought properties. Inconel 718: excellent LPBF, used in production aerospace. Aluminium AlSi10Mg: good AM properties. Stainless 316L: production-ready AM. Hardened tool steels: limited AM capability. Cast iron: not AM-compatible. Polymers: MJF nylon or ULTEM FDM for most functional applications.

Step 4: Property Check

Does the part require forging-level fatigue life or impact resistance? If yes, AM is unlikely to be the right choice – LPBF metals have fatigue properties approaching wrought but typically do not exceed cast, and are below forged properties. If static structural loads only: AM is viable.

AM in India: What Is Available in 2026

India’s additive manufacturing ecosystem has matured significantly:

  • Metal AM (LPBF/DMLS): Multiple service bureaux in Bengaluru, Pune, and Hyderabad operate EOS, SLM Solutions, and Renishaw LPBF systems. Tier-1 aerospace and defence AM suppliers (Cyient, Wipro 3D, TSAT) produce qualified aerospace components. Material certification (AS9100, NADCAP for AM) is available.
  • Polymer AM production: Multiple production-scale MJF (HP 4200, 5200) operators in Pune, Chennai, and NCR produce end-use parts for automotive and industrial OEMs.
  • Dental and medical AM: Dedicated dental CAD/CAM and metal AM ecosystem in Hyderabad, Mumbai, and Chennai for custom implants and prosthetics.
  • Research and capability: IIT institutions (Bombay, Madras, Delhi, Roorkee) and DRDO labs are active in AM research, providing a talent pipeline.

Key Takeaways

  • Additive manufacturing wins decisively below 50 units on cost and lead time vs any traditional manufacturing process.
  • Above 500 units, traditional manufacturing wins on unit cost for most part geometries – the exception is part consolidation, mass customisation, and topology-optimised designs.
  • The 50-500 unit range requires case-by-case evaluation; geometry complexity and weight sensitivity are the primary tie-breakers.
  • Metal AM (LPBF/DMLS) achieves mechanical properties close to wrought but does not match forged properties for fatigue-loaded applications.
  • India has production-qualified metal and polymer AM capability in 2026 – it is not necessary to source AM parts from Europe or the US.

FAQ

Q: Can AM-produced metal parts be used in aerospace structural applications?

A: Yes – with qualification. AM aerospace components are in production service at Airbus, GE Aviation, Boeing, and Safran. Qualification requirements: powder traceability, build parameter certification, NDT (CT scan or X-ray) for internal defects, mechanical coupon testing (UTS, fatigue), and design approval per the applicable airworthiness standard (EASA, FAA). India has NADCAP-accredited AM facilities capable of this qualification.

Q: What is the typical cost premium of metal AM over CNC machining for simple prismatic parts?

A: For a simple block or bracket (no complex internal features) at 10 units: AM is approximately 20-40% cheaper than CNC (no setup, faster). At 100 units: CNC is 30-50% cheaper than AM (setup amortises, machining is fast). At 500+ units: CNC is 60-80% cheaper. AM’s cost advantage on simple parts exists only at very low volumes.

Q: How do I specify quality requirements for an AM metal part from an India service bureau?

A: Specify: material specification (e.g., Ti-6Al-4V per AMS 4999 for LPBF), minimum density (above 99.5% for structural, above 99.8% for fatigue-loaded), surface roughness requirement (as-built Ra, or post-machined Ra for precision surfaces), NDT requirement (X-ray CT for internal defects if safety-critical), and mechanical property minimums (UTS, yield, elongation per build direction). Request material certifications and build parameter documentation with each order.

Medical Device Manufacturing in India: Standards, MDR Compliance, and Contract Manufacturer Guide 2026

Introduction

India’s medical device industry reached $11B in 2025 and is projected to reach $50B by 2030. Government policy (PLI for medical devices, dedicated medical device parks, 100% FDI under automatic route) has attracted global device manufacturers including Siemens Healthineers, GE Healthcare, BD, and Abbott to establish or expand India manufacturing. India is now a credible destination for Class I and Class II medical device contract manufacturing – and the regulatory framework (India MDR 2017) provides a clear compliance pathway for global manufacturers.

This guide covers India’s medical device manufacturing ecosystem, the regulatory framework, ISO 13485 supplier landscape, and how to qualify an Indian contract manufacturer for a medical device programme in 2026.

India’s Medical Device Regulatory Framework: MDR 2017

The Medical Devices Rules (MDR) 2017, amended in 2020 and 2023, brought India’s medical device regulation under a structured framework for the first time. Key provisions:

Device Classification

  • Class A (Low Risk): Non-sterile, non-measuring; stethoscopes, tongue depressors, bandages. No CDSCO license required for manufacture.
  • Class B (Low-Medium Risk): Sterile Class A, non-measuring powered devices; syringes, blood pressure monitors. CDSCO license required.
  • Class C (Medium-High Risk): Long-term implantable, life-sustaining; dialysis equipment, ventilators, orthopaedic implants. CDSCO license + technical review.
  • Class D (High Risk): Cardiac stents, pacemakers, HIV diagnostics. CDSCO license + clinical evidence evaluation.

Quality Management System Requirement

From 2024, all licensed medical device manufacturers in India must hold ISO 13485:2016 certification (or equivalent QMS). ISO 13485 is the international QMS standard for medical devices – analogous to ISO 9001 but with additional requirements for risk management, sterility, traceability, and post-market surveillance. Verify any Indian CM you consider holds current ISO 13485 from an accredited certification body.

Import and Export Registration

For devices imported into India: importer registration with CDSCO required. For devices manufactured in India for export: MDR 2017 does not require export registration (devices must comply with the destination country regulations – FDA 510(k)/PMA for US, CE mark for EU, TGA for Australia).

PLI Scheme for Medical Devices

The PLI scheme for Medical Devices (Rs 3,420 Cr) covers four product segments:

  • Segment A: Cancer care / radiology equipment (MRI, CT, X-ray) – high-value capital equipment
  • Segment B: Anaesthesia, cardiology, renal care, radiology, implants
  • Segment C: Orthopaedic implants, trauma implants, dental implants, IVD reagents
  • Segment D: PPE, syringes, needles, sutures – high-volume disposables

PLI incentive: 5% of incremental net sales in Year 1-4, declining to 4% in Year 5. Minimum investment threshold: Rs 50 Cr (Segment A) to Rs 25 Cr (Segment D). Current beneficiaries include HLL Lifecare, Trivitron, Poly Medicure, and subsidiaries of global device companies.

Medical Device Manufacturing Clusters in India

Andhra Pradesh Medical Device Park (Visakhapatnam)

Government-developed medical device park with common infrastructure: cleanrooms, sterilisation, warehousing. Tenants include Siemens Healthineers India, Dixon Technologies (medical), and multiple domestic manufacturers. Preferred destination for diagnostic equipment and imaging manufacturing.

Himachal Pradesh Baddi Cluster

Established pharma and medical device cluster; multiple Class I/II device manufacturers with ISO 13485 certification and WHO GMP compliance. Strong in disposables, packaging, and pharmaceutical combo products.

Tamil Nadu Medical Device Cluster (Chennai / Hosur)

Precision engineering capabilities support orthopaedic implant manufacturing (investment casting, CNC machining of titanium and cobalt-chrome). Multiple AS9100/ISO 13485 crossover manufacturers serve both aerospace and medical.

Pune / Maharashtra

Diagnostic equipment, surgical instruments, dental devices, and Class II IVD manufacturing. Hub for FDI in medical devices – GE Healthcare, BD, Stryker all have India operations in or near Pune.

What Indian Medical Device CMs Can Manufacture

High Confidence (Established Capability)

  • Single-use disposables (syringes, catheters, drainage bags, IV sets): Multiple ISO 13485 manufacturers with FDA-registered facilities
  • Surgical instruments (stainless steel, titanium): Sialkot-equivalent capability in Tamil Nadu and Karnataka clusters
  • Orthopaedic implants (Class C): Investment cast cobalt-chrome and CNC-machined titanium implants supplied to global device companies
  • Diagnostic IVD reagents and consumables: Hyderabad cluster; multiple FDA-registered manufacturers

Growing Capability (Qualification Required)

  • Class II active devices (patient monitors, infusion pumps): Electronics integration capability growing; validate per specific product requirements
  • Imaging accessories and transducers: Limited India capability; primarily assembled from imported sub-assemblies
  • Complex Class C active implants (pacemakers, cochlear implants): Not recommended for India primary manufacturing in 2026; component manufacturing viable

Qualifying an Indian Medical Device Contract Manufacturer

Minimum Qualification Requirements

  • ISO 13485:2016 certification current (verify certificate on IMDRF database or CB website)
  • CDSCO license for the relevant device class
  • For US export: FDA 510(k) clearance or PMA (if applicable) or FDA registration of the manufacturing facility
  • Cleanroom classification appropriate to the device: ISO Class 7 or 8 for terminally sterilised devices, ISO Class 5-6 for aseptic assembly
  • Sterilisation validation (EtO, gamma, autoclave) with current certificate – do not accept untested sterilisation processes

Quality System Deep Dive

Beyond ISO 13485 certification, verify: risk management per ISO 14971, software lifecycle per IEC 62304 (if applicable), biocompatibility testing per ISO 10993 (for body-contact materials), and post-market surveillance system. These are not optional in a compliant MDR 2017 quality system – their absence signals a paper QMS.

Key Takeaways

  • India is a credible medical device contract manufacturing destination in 2026 for Class I, Class II, and selected Class C devices.
  • ISO 13485:2016 is mandatory for licensed India medical device manufacturers; verify the certificate is current and from an accredited CB before engaging.
  • PLI for Medical Devices (Rs 3,420 Cr) is actively disbursing and covers high-volume disposables through advanced capital equipment.
  • The highest-confidence India medical device categories are: disposables, surgical instruments, orthopaedic implants, and IVD reagents.
  • For US and EU export programmes, FDA registration/510(k) clearance and CE mark certification status of the India facility is the primary compliance gate.

FAQs

Q: Can an India-manufactured medical device be exported to the US under a 510(k) clearance obtained in the US?

A: Yes – a 510(k) clearance covers the device regardless of where it is manufactured, provided the manufacturing site is registered with the FDA and the site is inspected under the QMSR (Quality Management System Regulation, effective February 2026). India FDA-registered manufacturing sites are subject to FDA inspection. Ensure your India CM has a current FDA establishment registration number before beginning export-oriented production.

Q: What is the typical lead time for a Class II medical device qualification in India?

A: From supplier selection to production approval (including DfM, tooling, sterility validation, biocompatibility testing, and first article inspection): 12-18 months for a new Class II device. For devices with existing 510(k) clearance being transferred to an India manufacturing site: the site change may require FDA notification (SMDA – Site Master File amendment) adding 3-6 months.

Q: How does India MDR 2017 align with international frameworks like IMDRF?

A: India is an IMDRF member and MDR 2017 aligns broadly with IMDRF principles for classification, QMS requirements, and post-market surveillance. India has bilateral recognition discussions with the EU and US for potential mutual recognition of conformity assessment – not yet in force as of 2026, but progressing through the US-India strategic trade framework.

How to Run an Effective Factory Audit in India: A Procurement Manager’s Complete Checklist

Introduction

A factory audit in India is not just a box-ticking exercise. It is the primary risk mitigation tool between committing programme spend and discovering quality problems after you’ve cut your existing supplier. Experienced procurement managers who audit India factories frequently – including for Tier-1 automotive OEMs, aerospace primes, and Fortune 500 industrials – have a consistent finding: the gap between a factory’s certification status and its actual operational quality can be substantial. This checklist gives you the assessment protocol that experienced auditors use.

Before the Audit: Preparation

Request in advance and review before arriving:

  • Current quality management certification (ISO 9001, IATF 16949, AS9100, ISO 13485) – verify the certificate is current (not expired), issued by an accredited CB, and covers the relevant scope (not just head office)
  • Customer list: who do they supply, for how long, at what quality level (PPM data)
  • Quality data: defect rate (PPM or DPMO), customer complaints in last 12 months, field returns data
  • CAPEX and equipment list: what machinery do they operate, age, maintenance records
  • Revenue and workforce size: understaffing relative to revenue is a red flag for quality system coverage

Section 1: Quality Management System Assessment

Documentation and Control

  • Are quality procedures documented, current, and controlled (version-numbered, review date)?
  • Are operators working to documented work instructions, or from memory?
  • Is the document control system functional (superseded versions removed from production floor)?
  • Are calibration certificates current for all measurement equipment? Ask to see 3 random instruments.
  • Is the CAPA (Corrective and Preventive Action) system active – is there a log of open and closed CAPAs with root cause analysis?

Management Review

  • Has a management review meeting been held in the last 6 months? Ask to see the minutes.
  • Are quality KPIs (PPM, OTD, scrap rate) tracked, displayed, and reviewed by management?
  • Is there a defined quality policy signed by the site leader?

Section 2: Manufacturing Process Assessment

Process Controls

  • Are control plans in place for each key process? Are they specific (not generic) to the actual products manufactured?
  • Is SPC (Statistical Process Control) being used on critical dimensions? Are charts current and showing in-control processes?
  • Are process parameters (temperature, pressure, speed, feed) controlled and recorded? Ask to see a production traveller for a recent job.
  • Is incoming material inspection performed? Ask to see incoming inspection records for the last 10 lots.
  • Is a first article inspection (FAI) procedure in place and routinely followed?

Non-Conforming Material Control

  • Is there a clearly marked and physically segregated quarantine area for non-conforming material?
  • Is all material in the quarantine area tagged with disposition status?
  • Is there a material review process for disposition of non-conforming parts (scrap, rework, use-as-is)?
  • Has the quarantine area been cleaned recently, or is it full? A full quarantine area is a sign of unreported quality problems.

Section 3: Equipment and Measurement Capability

Equipment Condition

  • Walk the production floor with attention to: machine cleanliness (clean machines are maintained machines), coolant condition, tooling storage (organised vs scattered), work-in-process flow (logical vs chaotic)
  • Ask to see the Preventive Maintenance schedule for 3 critical machines. Is it current?
  • Check calibration status on measurement equipment: CMMs, micrometers, calipers, torque wrenches. Calibration stickers should show current calibration date and next due date.
  • Is there a gauge R&R (repeatability and reproducibility) programme for critical gauges?

Test and Inspection Equipment

  • Does the supplier have the in-house test equipment required for your product (hardness tester, CMM, surface profilometer, functional test rigs)?
  • Is test equipment NABL (National Accreditation Board for Testing and Calibration Laboratories) accredited or traceable to national standards?
  • For electronics: does the supplier have AOI (Automated Optical Inspection), ICT (In-Circuit Test), or functional test equipment relevant to your programme?

Section 4: Workforce Assessment

Operator Competency

  • Are operators trained to documented procedures? Ask to see training records for 3 random production operators.
  • Are critical process operators certified (e.g., IPC-A-610 CIS for electronics soldering, ASNT Level II for NDT)?
  • Ask a production operator to demonstrate the control plan for their process – can they explain what they are checking and why?
  • What is the supervisor-to-operator ratio? Below 1:15 on complex assembly is a risk indicator.

Retention and Stability

  • What is the annual workforce turnover rate? Above 30-40% is a quality risk (constant retraining, loss of process knowledge).
  • How long has the production manager / quality manager been in role? Frequent leadership turnover destabilises quality systems.
  • Is the workforce directly employed, or heavily contractor-dependent? High contractor ratios reduce quality accountability.

Section 5: Supply Chain and Materials

  • Does the supplier maintain an approved vendor list (AVL) for their key raw materials and sub-components?
  • Are supplier quality agreements in place for critical materials?
  • Is Tier-2 supply chain visibility maintained? Ask: do they know where their primary raw materials come from?
  • For chemical-intensive processes: are hazardous materials stored, handled, and disposed per regulatory requirements (MSDS available, segregation, ventilation)?

Red Flags That Should Pause Qualification

  • Calibration stickers missing or expired on measurement equipment: suggests systemic quality system breakdown
  • Quarantine area overflowing with tagged non-conforming material: suggests unreported quality problems
  • Certificates presented during audit that are expired or cover a different scope than the facility you are auditing
  • Operators unable to explain what they are checking or what the pass/fail criteria are
  • Customer reference list that cannot be verified (no contact names, suppliers unable to provide letters of commendation)
  • Production floor where the “show area” is clean but the back of the factory is chaotic – staged audits are real

Green Flags That Indicate a Mature Supplier

  • SPC charts on the production floor that show recent data (not last month’s) with evidence of response to out-of-control signals
  • Quality KPI trend charts visible in the production area showing month-on-month improvement
  • Operators who can spontaneously describe the FMEA risk for their process and what the detection method is
  • A quality manager who proactively points out weaknesses during the audit (self-aware suppliers improve; defensive suppliers don’t)
  • Multiple current customer reference letters from recognisable global OEMs (Toyota, Bosch, Honeywell)

Key Takeaways

  • A factory audit in India is not a certification check – it is an operational quality assessment. Certification is necessary but not sufficient.
  • The highest-value audit activities are: CAPA system review, production-floor conversation with operators, quarantine area inspection, and calibration verification.
  • Red flags that should pause qualification: expired calibrations, full quarantine area, operators unaware of control criteria, and certificates covering wrong scope.
  • A staged audit (clean show area, messy back areas) is a real risk in India and globally – walk the entire facility, not just the presentation area.
  • The best predictor of future quality is the supplier’s current customer reference list and their PPM data with those customers.

FAQs

Q: Should I conduct a factory audit myself or use a third-party audit firm?

A: For initial qualification of high-risk or high-spend suppliers: conduct your own audit (use this checklist), supplemented by a third-party audit from a firm with India manufacturing expertise (SGS, Bureau Veritas, Intertek, TUV SUD India). Third-party audits add credibility for regulatory submissions. For ongoing surveillance of qualified suppliers: third-party annual audits are cost-efficient. For critical programmes: both.

Q: How long should a factory audit take?

A: Full qualification audit for a medium-complexity supplier: 1 full day (6-8 hours on-site). Targeted process audit for a specific concern: half day. Routine surveillance audit of an established supplier: 4 hours. Do not accept supplier-organised audits that are compressed to 2 hours – the production floor walk alone should take 90 minutes for a meaningful assessment.

Q: What are the most important questions to ask the quality manager during an India factory audit?

A: (1) What was your worst quality escape in the last 12 months – what happened and what did you change? (A supplier who can answer this has a functioning quality system. A supplier who says they have had no quality escapes is either exceptional or not measuring.) (2) Show me the last 3 corrective actions you issued to your own suppliers. (3) What is your current internal scrap rate by process?

Green Manufacturing and Scope 3 Emissions: How India Sourcing Reduces Your Supply Chain Carbon Footprint

Introduction

In 2026, Scope 3 supply chain emissions are no longer a sustainability report footnote – they are a procurement criterion, an investor disclosure requirement, and an increasingly literal cost under the EU Carbon Border Adjustment Mechanism (CBAM). For manufacturing companies with net-zero commitments or EU export programmes, the carbon intensity of their supply chain – including the electricity used to manufacture their components – now affects both compliance and cost.

India’s energy transition, combined with its lower-carbon manufacturing profile versus China for specific categories, makes it an increasingly relevant variable in Scope 3 reduction strategy. This article gives procurement and sustainability teams the data they need.

Why Manufacturing Location Affects Scope 3 Emissions

Scope 3 emissions (Category 1: Purchased Goods and Services) are dominated by:

  • Electricity used in manufacturing (grid emission factor of supplier country/region)
  • Process energy (thermal – coal, gas, oil for furnaces, dryers, kilns)
  • Logistics emissions (shipping mode and distance)
  • Material extraction and processing (upstream Scope 3)

The single largest variable is grid electricity carbon intensity – the kg of CO2 equivalent emitted per kWh consumed. This varies dramatically by country:

  • China national grid average (2025): 0.581 kg CO2e/kWh (coal-heavy grid)
  • India national grid average (2025): 0.472 kg CO2e/kWh (improving with renewable additions)
  • India Tamil Nadu / Rajasthan grid (high-renewable zones): 0.320-0.380 kg CO2e/kWh
  • India industrial parks with captive solar/wind: 0.150-0.250 kg CO2e/kWh
  • EU average: 0.233 kg CO2e/kWh
  • US average: 0.371 kg CO2e/kWh

For an energy-intensive manufacturing process consuming 500 kWh per tonne of output, switching from China to a renewable-powered India industrial park reduces electricity-related Scope 3 emissions by 40-70%.

India’s Renewable Energy Transition: The Manufacturing Implication

India reached 200 GW of installed renewable energy capacity in 2024 and is targeting 500 GW by 2030. In manufacturing terms, this means:

  • Multiple states (Tamil Nadu, Rajasthan, Gujarat, Karnataka) now have renewable energy surplus – enabling genuine green power procurement for industrial consumers.
  • Open Access renewable power (directly contracted with generators) is available in most major manufacturing states, enabling manufacturers to lock in low-carbon power at 20-30% lower tariff than grid power.
  • Government industrial parks in renewable-energy-rich states offer pre-built renewable supply infrastructure – buyers can specify “green-powered facility” in RFQs.
  • India’s national green energy grid corridor investment (Rs 20,440 Cr) is enabling interstate renewable power transfers, democratising access to green power.

Carbon Border Adjustment Mechanism (CBAM) and India Sourcing

The EU’s CBAM, fully phased in from January 2026, applies a carbon price to embedded emissions in imports of steel, aluminium, cement, fertilisers, hydrogen, and electricity from non-EU countries. Importers must purchase CBAM certificates matching the carbon price they would have paid under EU ETS.

India vs China CBAM comparison for steel products (illustrative):

  • China steel production: Approximately 2.0-2.4 tonnes CO2e per tonne of steel (blast furnace, coal-based)
  • India steel production (DRI/EAF route, Tata Steel, JSW): Approximately 1.4-1.8 tonnes CO2e per tonne
  • India steel with green hydrogen DRI (pilot projects in 2026): Below 0.5 tonnes CO2e per tonne (emerging)
  • At an EU ETS carbon price of 80 EUR/tonne CO2, the CBAM cost difference between India and China steel can reach 48-80 EUR per tonne – a significant landed cost variable for steel-intensive products.

Building a Green Supply Chain with India Sourcing

Step 1: Measure Current Scope 3 Baseline

Before optimising, measure. Calculate Scope 3 Category 1 emissions using your current China supplier spend data: tonnes of product x emission factor (kg CO2e/kg for typical material and process). Primary sources: supplier-provided EPD (Environmental Product Declaration), IPCC emission factors, or Ecoinvent database.

Step 2: Identify High-Emission, India-Substitutable Categories

Rank your BOM by: Scope 3 emission intensity (kg CO2e/$ spend) x substitutability with India supplier. High-emission, India-substitutable categories include: steel forgings and castings, aluminium die castings, precision machined steel components, and electronics assemblies.

Step 3: Specify Green Criteria in India RFQs

Include in your RFQ: request for supplier’s power purchase agreement (PPA) documentation for renewable energy, electricity consumption per unit of output (allows you to calculate Scope 3 reduction), and supplier’s annual GHG inventory (if available). Prefer suppliers in Tamil Nadu, Rajasthan, and Gujarat industrial parks with documented green power access.

Step 4: Claim and Report the Reduction

Document the emission factor of your India supplier vs previous China supplier. Report the reduction as Category 1 Scope 3 improvement under GHG Protocol. Quantify the avoided carbon cost under CBAM or internal carbon pricing frameworks.

Indian Certifications Relevant to Green Manufacturing

  • BEE (Bureau of Energy Efficiency) Star Rating: Indian energy efficiency certification for industrial facilities. Higher star rating = lower energy intensity.
  • GreenPro Certification (CII): Indian green product certification for manufactured goods, covering lifecycle emissions, water use, and hazardous substance content.
  • ISO 14001 (Environmental Management System): International standard; widely held by export-oriented Indian manufacturers. Verifies systematic approach to environmental management.
  • Carbon Disclosure Project (CDP) Supply Chain: Increasingly adopted by large Indian manufacturers supplying to global companies with CDP commitments.

Key Takeaways

  • India’s grid carbon intensity is 19% lower than China’s national average and improving rapidly with renewable additions.
  • India industrial parks with captive solar/wind power offer emission factors 60-70% below China’s coal-heavy grid.
  • EU CBAM creates a direct financial incentive to source steel and aluminium from lower-carbon India manufacturers vs high-carbon Chinese equivalents.
  • Specifying renewable energy access and ISO 14001 in India RFQs is achievable and increasingly standard practice for export-oriented Indian manufacturers.
  • Scope 3 Category 1 reduction from India sourcing can be material (20-40% per component category) and directly reportable under GHG Protocol.

FAQ

Q: How do I get verified emission data from an Indian supplier for Scope 3 reporting?

A: Request an Environmental Product Declaration (EPD) if the supplier has one. If not, request electricity consumption per unit of output + power purchase documentation. Use the electricity data with CEA (Central Electricity Authority) India published grid emission factors by state to calculate Scope 3 emissions. For higher precision, engage a third-party carbon accounting firm to conduct a supplier-specific LCA.

Q: Does sourcing from India count as “domestic” for US IRA manufacturing content requirements?

A: No. US IRA domestic content requirements specify US-origin manufacturing for maximum incentives. India is not a free trade agreement partner with the US (as of 2026, although negotiations are advancing). For IRA compliance, India sourcing does not qualify for domestic content bonuses but does benefit from standard MFN tariff treatment vs China’s Section 301 tariff surcharges.

Q: What is the carbon footprint of shipping goods from India vs China to the US?

A: India to US East Coast by sea: approximately 18-22 days transit, ~0.010-0.012 kg CO2e per tonne-km (Maersk Emission Factor 2025). China to US West Coast: approximately 14-16 days, similar emission factor. The difference in logistics emissions between India and China sourcing is small relative to the manufacturing process emission difference – typically less than 5% of total supply chain carbon.

Injection Moulding in India: Complete Guide to Plastic Part Manufacturing and Sourcing

Introduction

India processes over 12 million tonnes of plastic annually and has more than 30,000 plastics processing units. Yet most global buyers sourcing injection moulded parts default to China without evaluating India – leaving 20-35% cost savings on the table for non-cosmetic, industrial, and automotive plastic parts where India is genuinely competitive. This guide maps India’s injection moulding ecosystem, what it can and cannot do, how to specify parts correctly, and how to qualify Indian moulders for global supply programmes.

India’s Injection Moulding Ecosystem: Capabilities and Clusters

Automotive Plastic Components – Mature and Export-Ready

India’s automotive plastic parts industry supplies to Maruti Suzuki, Hyundai, Tata Motors, and through tier-1 suppliers (Motherson, Faurecia India, Pricol, Varroc) to global automotive OEMs. Capabilities include: instrument panels, door trim assemblies, bumper systems, fuel system components, under-hood parts in PA66, PBT, and HDPE. IATF 16949-certified moulders are the norm for automotive.

Industrial and Engineering Plastics – Growing

Engineering plastic moulding (PA, POM, PPS, PEEK, PEI) for industrial applications: pump housings, valve bodies, bearing retainers, conveyor components, and electrical enclosures. Manufacturers in Pune, Ahmedabad, and Bengaluru handle engineering plastics with in-house tool rooms.

Consumer Electronics and Appliance Components – Competitive for Functional Parts

India moulders produce functional enclosures, connectors, and internal components for consumer electronics assembled in India (primarily for Foxconn, Tata, and Samsung’s India operations). For Class-A cosmetic surface finish consumer products (phone casings, premium appliance aesthetics), China remains ahead on mould polish quality and cycle time.

Medical Device Components – Developing

ISO 13485-certified injection moulding for medical grade plastics (HDPE, PP, ABS, PC, PSU, PEEK) is growing. Cleanroom moulding facilities (ISO Class 7/8) are available in Pune, Hyderabad, and Chennai. India Medical Device Rules (MDR 2017) compliance is the regulatory framework for India-market devices; for export programmes, FDA 21 CFR Part 820 or EU MDR compliance is required.

Tooling (Mould) Costs in India vs China

Tooling cost comparison for a typical single-cavity injection mould:

  • Simple part (no lifters, 2-plate tool): China $2,500-6,000 | India $3,500-8,000
  • Medium complexity (4-plate, slides): China $8,000-20,000 | India $10,000-25,000
  • Complex part (hot runner, multiple slides, high polish): China $20,000-60,000 | India $28,000-80,000
  • Multi-cavity mould (8-cavity, standard): China $12,000-30,000 | India $15,000-38,000

India’s tooling cost premium over China is 20-35%. However, for programmes where the buyer intends to keep tooling in India (for supply chain security, tariff avoidance, or import duty reasons), the tooling premium is a one-time cost recovered quickly through lower unit prices.

Unit Cost Comparison: When India Is Cheaper

India moulding unit costs are competitive vs China for:

  • Parts with high assembly labour content (insert moulding, overmoulding): India wins by 25-35%
  • Large structural/industrial parts (wall thickness above 3mm, high shot weight): India competitive within 10%
  • Low-to-medium cavitation tools (1-4 cavity): India competitive
  • Engineering plastics with manual insert loading: India wins by 20-30%

India is less competitive than China for:

  • Ultra-high-cavitation moulds (16+ cavity, thin-wall consumer packaging): China’s mould precision and cycle time optimisation is superior
  • Class-A cosmetic finishes for consumer electronics: Chinese mould polishing and EDM texture capability is ahead
  • Very high volumes requiring 24/7 automated cells: China’s automation investment is greater

DfM Rules for India Injection Moulding: What to Check Before Tooling

Wall Thickness

Uniform wall thickness is the single most important DfM rule. Nominal wall should be 2-4mm for most engineering plastics. Variation greater than 25% from nominal creates sink marks and warpage. For thin-wall moulding (below 1.5mm), specify to moulders with documented thin-wall experience.

Draft Angles

Minimum 1 degree draft on all vertical walls for easy ejection. Textured surfaces require 3-5 degrees. Insufficient draft causes drag marks and ejection damage – the most common DfM mistake from engineers who work in metals.

Gate Location

Gate location affects weld line position, surface finish, and filling pressure. Work with the moulding supplier on gate location during DfM review – before tooling is cut. Moving a gate after tool fabrication is costly.

Undercuts

Undercuts require side actions (slides or lifters) which add $500-5,000 per action to tooling cost. Redesign to eliminate undercuts where possible; if unavoidable, call them out explicitly in the design review.

Sink Marks and Boss Design

Boss wall thickness should be 60-70% of nominal wall. Ribs should be 40-60% of nominal wall. Exceeding these ratios creates sink marks on the opposite face. This is a non-negotiable rule for appearance surfaces.

Quality Standards for Injection Moulded Parts in India

  • Automotive: IATF 16949 (quality management system), customer-specific requirements (VDA 6.3 for VW-group, AIAG PPAP for US OEMs)
  • Industrial: ISO 9001 as minimum; EN/ISO 10350 for material property verification
  • Medical: ISO 13485, cleanroom certification per ISO 14644, material biocompatibility per ISO 10993
  • Electronics: IEC 60695 (flammability), UL 94 rating on resin selection
  • Food-contact: FDA 21 CFR food contact approval on resin, EU 10/2011 migration testing

How to Qualify an India Injection Moulding Supplier

Toolroom Assessment

Visit or audit the in-house tool room (or confirm tool shop relationship for outsourced tooling). Check: CNC machining and EDM equipment (age, maintenance), mould steel standard used (P20, H13 for standard tools; S136, 420 SS for corrosive resins), mould flow simulation capability (Moldflow or equivalent).

Press Fleet Assessment

Injection moulding presses are rated by clamping force (tonnes). Check: press fleet size and age (equipment under 10 years preferred), clamping force range (needs to match your part projected area), process controls (closed-loop pressure/velocity, temperature controllers), maintenance records.

Material Management

Verify: incoming material inspection (MFR/viscosity testing on each lot), drying equipment (dehumidifying dryers for hygroscopic resins: PA, PC, PET, PBT), material traceability to lot number, segregation of medical-grade vs industrial-grade resins.

Key Takeaways

  • India is cost-competitive for injection moulding in automotive parts, industrial engineering plastics, and labour-intensive assemblies (insert moulding, overmoulding).
  • India’s tooling costs are 20-35% higher than China but recovered through lower unit costs on medium-to-high volume programmes.
  • China retains an advantage for Class-A cosmetic consumer electronics and ultra-high-cavitation thin-wall packaging.
  • DfM review before tooling – specifically wall thickness, draft, gate location, and undercuts – is the single highest-leverage quality intervention.
  • India has IATF 16949, ISO 13485, and ISO 9001-certified moulders for automotive, medical, and industrial programmes respectively.

FAQ

Q: Can India moulders handle overmoulding (TPE over rigid substrate) and 2K moulding?

A: Yes – multiple India moulders have 2K (two-component) and overmoulding capability for automotive soft-touch interiors, industrial grips, and sealing applications. Specify 2K capability explicitly in your RFQ and request reference parts during qualification.

Q: How do I specify colour matching for injection moulded parts from India?

A: Specify Pantone or RAL colour reference. Require colour master approved prior to production (limit sample process). Specify Delta-E tolerance (typically Delta-E below 1.0 for automotive, below 2.0 for industrial). Request colour control plan from the supplier showing measurement frequency and instrument (spectrophotometer).

Q: What import duties apply to India-origin plastic parts entering the US and EU?

A: Most injection moulded plastic components from India enter the US at standard MFN duty rates of 2.5-6.3% depending on HTS code – far below the 25%+ Section 301 rates applying to Chinese-origin equivalents. EU-India FTA negotiations in 2025-2026 are expected to further reduce or eliminate duties on Indian-origin manufactured goods.

Forging vs Casting: How to Choose the Right Metal Forming Process for Your Part

Introduction

Forging and casting are both net-shape or near-net-shape metal forming processes – but they produce fundamentally different internal structures, mechanical properties, and cost profiles. A crankshaft that should be forged but is cast will fail prematurely. A complex valve housing that should be cast but is specified for forging will cost 3x more than necessary. The process selection decision is one of the highest-leverage engineering choices in metal part design.

This guide gives you a systematic framework for choosing between forging and casting based on the factors that determine part performance and cost: mechanical properties, geometry, material, volume, and application criticality.

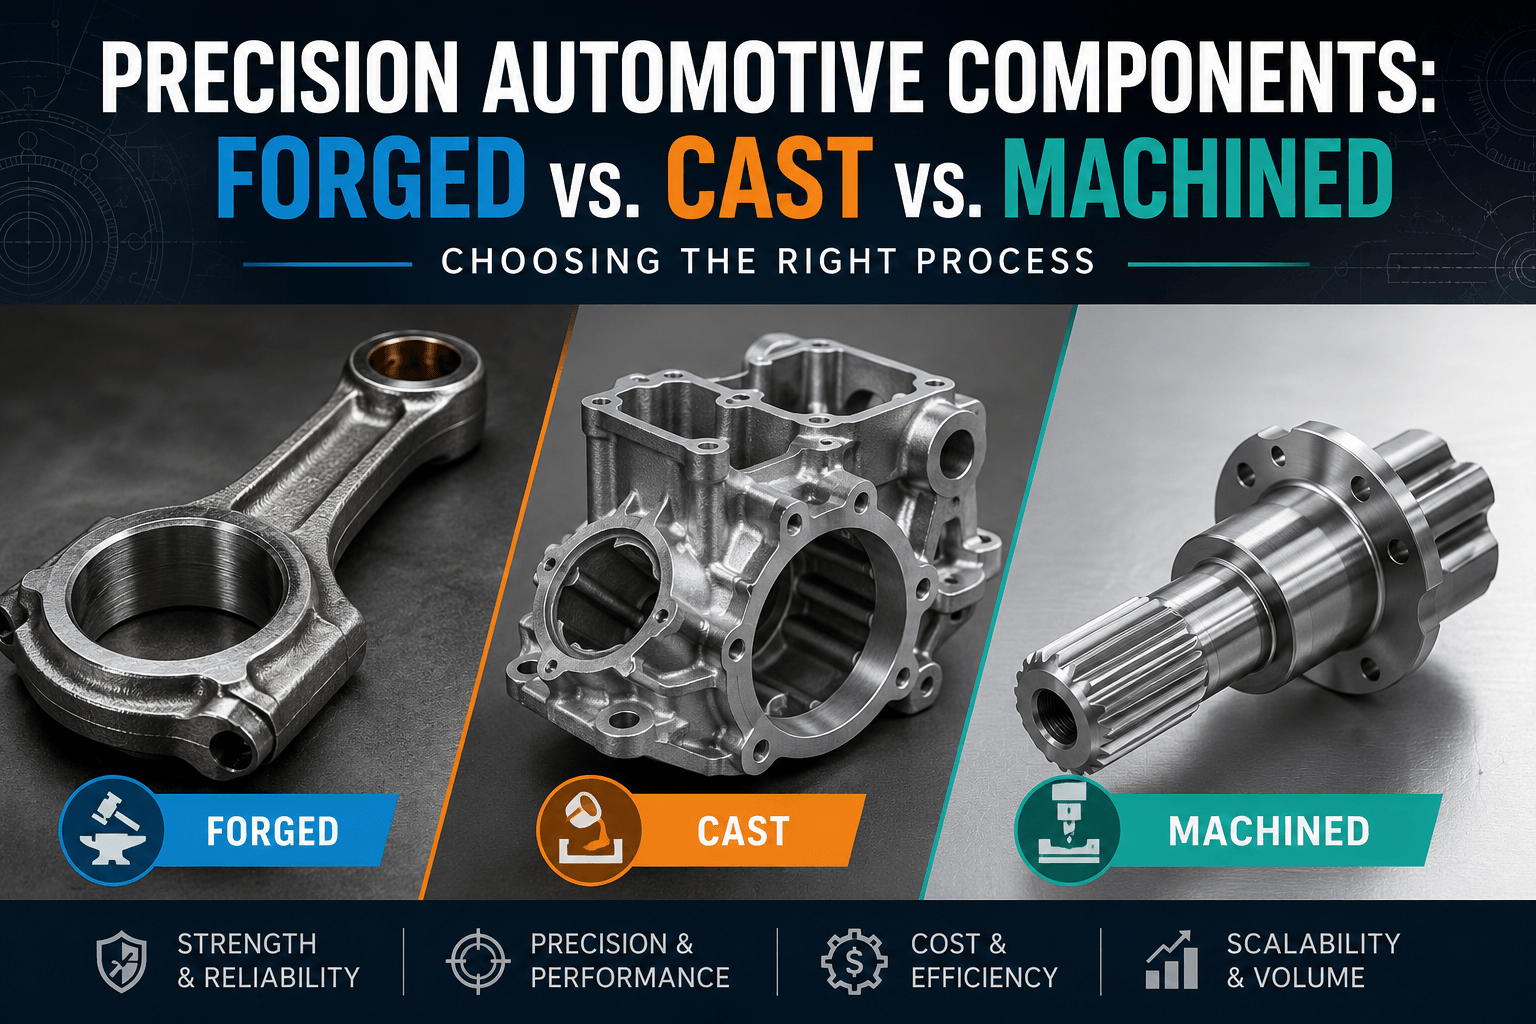
Process Overview

Forging

Forging applies compressive force to a heated metal workpiece – using hammers, presses, or rolls – to shape it while simultaneously improving its internal grain structure. The forging process works the metal, breaking up porosity, aligning grain flow with part geometry, and producing a dense, directionally-strong microstructure.

Process variants: Open-die forging (large, simple shapes), closed-die forging (complex net-shape parts in a die), ring rolling (rings and flanges), roll forging (bars and rods).

Casting

Casting pours molten metal into a mould and allows it to solidify. The mould defines the part geometry; the metal fills complex cavities that would be impossible to forge. Casting produces a randomly-oriented grain structure with some inherent porosity risk, but enables geometrical complexity that forging cannot achieve.

Process variants: Sand casting (large parts, low tooling cost), investment casting (complex geometry, excellent surface finish), die casting (high-volume non-ferrous), lost-foam casting.

Mechanical Properties: The Most Critical Difference

This is where forging wins decisively. The forging process produces:

  • Grain flow aligned to part geometry: In a forged crankshaft, grain lines follow the contour of the pin journals and web, maximising fatigue resistance along stress paths. A cast crankshaft has random grain orientation.
  • Higher strength and toughness: Forged steel typically achieves 20-30% higher yield strength and 30-50% higher fatigue life than equivalent cast steel at the same alloy and heat treatment.
  • No porosity: Forging works out internal voids. Casting always carries some porosity risk (managed with process control, but never eliminated).
  • Better impact resistance: Forged parts absorb impact energy through plastic deformation before fracture; cast parts tend to fracture more abruptly.

Practical consequence: Any part that carries cyclic loading (fatigue), impact loads, or safety-critical stress must be forged. Any part where weight reduction per unit strength is the design goal should be forged.

Head-to-Head Comparison

  • Mechanical Strength: Forging – Superior (20-30% higher UTS vs cast equivalent) | Casting – Good (adequate for many applications)
  • Fatigue Life: Forging – Very High (grain flow alignment) | Casting – Moderate (random grain, porosity risk)
  • Porosity: Forging – None (compressive process eliminates voids) | Casting – Present (managed but inherent)
  • Geometry Complexity: Forging – Limited (parting line constraint, no internal cavities) | Casting – Excellent (internal passages, complex 3D geometry)
  • Material Range: Forging – Steel, aluminium, titanium, nickel alloys | Casting – Virtually any metal including superalloys
  • Surface Finish (as-formed): Forging – Moderate (Ra 3.2-6.3 micron) | Casting – Good (investment: Ra 1.6-3.2 micron)
  • Dimensional Tolerance (as-formed): Forging – Medium (+/- 0.5-2mm) | Casting – Better for investment (+/- 0.1-0.25mm)
  • Tooling Cost: Forging – High ($20,000-200,000 for closed-die) | Casting – Medium-Low ($3,000-50,000)
  • Unit Cost (volume): Forging – Low at high volume | Casting – Low to medium
  • Best Volume: Forging – 5,000-1,000,000+ units/year | Casting – 100-500,000 units/year

When to Use Forging

Forging is mandatory or strongly preferred when:

  • Part carries cyclic/fatigue loading: crankshafts, connecting rods, wheel hubs, axle shafts, gear blanks, surgical implants, aircraft structural components
  • Part must not fail catastrophically: safety-critical fasteners, aircraft landing gear, engine connecting rods, suspension knuckles
  • High strength-to-weight ratio is required: aerospace structures, race car components, high-performance automotive parts
  • Impact resistance is critical: hand tools, mining equipment, off-highway vehicle components
  • The geometry can be formed with simple parting lines and no internal cavities

When to Use Casting

Casting is preferred when:

  • Part has complex internal geometry: valve bodies with multiple ports, pump casings with internal volutes, turbine blades with internal cooling channels
  • Material is a superalloy, cast iron, or titanium alloy where forging is impractical or prohibitively expensive
  • Volume is below the threshold for forging die amortisation (typically below 5,000 units/year)
  • Part is structural/static with no fatigue loading: brackets, housings, manifolds, frames
  • Near-net shape with tight tolerances is required without post-machining: investment cast valve bodies at +/- 0.15mm

Material-Process Compatibility

Aluminium Alloys

Both forging (6061-T6, 7075-T6) and casting (A356, A380 die cast) are mature. Forged aluminium is preferred for structural aerospace and automotive (wheels, suspension). Cast aluminium dominates for housings, engine blocks (die cast), and decorative applications.

Steel and Alloy Steels

Steel forgings (4140, 4340, 8620) are the backbone of automotive and industrial power transmission. Cast steel (investment cast or sand cast) handles complex housings and valve bodies. Cast iron (grey, ductile) remains dominant for engine blocks, brake discs, and machine beds – rarely forged.

Titanium

Titanium forging (Ti-6Al-4V) is standard for aerospace structural components (frames, fasteners, landing gear). Titanium casting (investment cast) handles complex aerospace fittings and biomedical implants. Both require inert atmosphere or vacuum to prevent oxidation during processing.

Nickel Superalloys

Nickel superalloy forgings (Inconel 718, Waspaloy) are used for turbine discs, compressor blades, and high-temperature structural parts. Nickel superalloy castings (investment cast) produce turbine blades with cooling channels. These are complementary – turbine disc = forged; turbine blade = investment cast.

India’s Forging and Casting Ecosystem

India is the world’s second-largest forging industry (after China) with annual output exceeding $5B. Rajkot is Asia’s largest forging cluster. Pune, Aurangabad, and Ludhiana are major secondary clusters. Key capability: steel forgings for automotive (crankshafts, connecting rods, axle beams, flanges), industrial (flanges, fittings), and oil and gas (pressure vessel components, pipeline fittings).

India’s casting industry is also globally significant, with investment casting, sand casting, and die casting capabilities in Coimbatore (pumps, compressors), Rajkot (valves, fittings), Pune (automotive castings), and Kolkata (heavy castings). Indian investment castings supply aerospace and defence OEMs globally.

Key Takeaways

  • Choose forging for fatigue-loaded, impact-resistant, safety-critical parts where grain flow alignment and absence of porosity are functional requirements.
  • Choose casting for geometrically complex parts, superalloy and cast iron materials, lower volumes, and applications where geometry cannot be achieved by forging.
  • Forging produces 20-30% higher strength at equivalent alloy and heat treatment – this is a structural property advantage, not just a process preference.
  • India is the world’s second-largest forging industry with a mature export base: Rajkot, Pune, and Ludhiana clusters supply global automotive and industrial OEMs.
  • The forging vs casting decision should be made during design – switching processes after tooling investment is expensive and disruptive.

FAQ

Q: Can a part be designed for forging and then switched to casting to save money?

A: Only if the application does not require forging’s mechanical properties. Switching a fatigue-loaded part from forging to casting to save tooling cost is a safety risk – casting will have lower fatigue life. For non-fatigue-loaded structural parts (brackets, housings), switching can be economical if geometry is compatible.

Q: What is the typical tooling cost difference between forging and investment casting?

A: Closed-die forging tooling: $20,000-200,000 depending on part complexity and material. Investment casting wax die tooling: $3,000-30,000. The tooling cost gap means casting is more economical below approximately 5,000-10,000 units/year; above that volume, forging’s lower unit cost makes it preferable for compatible geometries.

Q: How do I specify forging quality on a drawing?

A: Key specifications: material grade and heat treatment (e.g., AISI 4340, quench and temper to 40-45 HRC), forging grain flow direction (specify if critical), forging class (per ASTM A788 or equivalent), Charpy impact test if required, ultrasonic testing for internal discontinuities per ASTM A388, and dimensional tolerances per DIN 7526 or equivalent forging tolerance standard.

Wire Harness Manufacturing in India: Cost Advantage, Capability, and Supplier Qualification Guide

Introduction

Wire harness manufacturing is the most labour-intensive sub-assembly in automotive and industrial manufacturing. A single passenger vehicle contains 1-3 km of wiring and 500-2,000 electrical connections. At $15-80 per harness (automotive), labour represents 55-65% of total cost. This makes wire harness manufacturing the category where India’s labour cost advantage is most decisive – and why India is already the world’s third-largest wire harness exporter, supplying to Toyota, Honda, Volkswagen, and General Motors assembly lines globally.

This guide covers India’s wire harness manufacturing ecosystem, cost benchmarks, quality standards, supplier qualification, and how to establish India sourcing for harness programmes in 2026.

Why Wire Harnesses Are India’s Strongest Contract Manufacturing Advantage

Wire harness assembly is fundamentally a hand-work intensive process. Automated assembly covers crimping, cutting, and terminal insertion but cannot fully automate the routing, binding, labelling, and quality inspection steps that make harnesses complex. The labour content cannot be automated away – which means the country with the lowest skilled-labour cost wins permanently.

Labour cost comparison for wire harness assembly (2026 estimates):

  • China (coastal): $3.80-5.20/hour for harness assembler
  • Mexico: $4.50-6.00/hour
  • Eastern Europe (Romania, Poland): $7.00-11.00/hour
  • India (Tier-1 cities): $1.00-1.60/hour
  • India (Tier-2 cities – Hosur, Pune, Nashik): $0.75-1.20/hour

For a harness with 4 hours of assembly labour, India saves $10-16 per unit versus China and $24-40 per unit versus Eastern Europe. At 100,000 units/year, that is $1-4M in annual savings.

India’s Wire Harness Manufacturing Ecosystem

Tier-1 Global Suppliers with India Manufacturing

Motherson Sumi Systems (now Samvardhana Motherson International) is the world’s largest wire harness manufacturer by revenue and operates multiple India plants supplying Toyota, Volkswagen, and Honda globally. Pricol Technologies, Minda Industries, and Spark Minda supply domestic OEMs (Maruti Suzuki, Tata Motors, Mahindra) and export harnesses to Europe and Japan.

Contract Manufacturers for Non-Automotive Harnesses

India has a significant mid-tier harness manufacturing base for industrial, aerospace, defence, and consumer electronics applications. Companies in Pune, Bengaluru, Hosur, and Chennai manufacture harnesses to IPC-A-620 (wiring harness workmanship), DEF STAN, and customer-specific standards. These are the relevant suppliers for non-automotive buyers.

Key Manufacturing Clusters

  • Pune / Nashik: Automotive wire harness hub; Motherson, Minda, tier-2 suppliers
  • Chennai / Hosur: Auto and electronics harness manufacturing
  • Bengaluru: Aerospace and defence harness manufacturing (AS9100 certified suppliers)
  • Noida / Gurugram: Industrial and commercial harness manufacturing

Quality Standards for Wire Harnesses: What to Specify

IPC-A-620 (Acceptability of Cable and Wire Harness Assemblies)

The primary quality standard for wire harness workmanship. Specifies acceptability criteria for soldering, crimping, routing, bundling, labelling, and connector insertion. Three classes: Class 1 (general electronics), Class 2 (dedicated service), Class 3 (high-reliability aerospace/defence). Always specify IPC-A-620 Class in your purchase specification and verify supplier holds current IPC Certified Interconnect Specialist (CIS) certification.

USCAR-2 (Automotive Wire Crimp Performance Standard)

The automotive-specific crimp performance standard specifying pull force, cross-section, and electrical resistance requirements for crimped terminals. Required for any automotive-grade harness. Indian automotive harness manufacturers supplying to global OEMs hold USCAR-2 compliance as a baseline requirement.

IPC-J-STD-001 (Soldering)

For harnesses with soldered connections (junction blocks, pigtails, tinned end splices). Specifies soldering materials, flux residue, and inspection criteria. J-STD-001 Class 3 for aerospace/defence, Class 2 for industrial.

AS9100 (Aerospace Wire Harnesses)

Any wire harness destined for aerospace or defence applications requires AS9100 Rev D supplier certification as a minimum. India has AS9100-certified harness manufacturers in Bengaluru and Pune.

The Wire Harness Supplier Qualification Process

Step 1: Define Specification Package

Before issuing RFQs, prepare: harness drawing (or 3D cable design file), wire gauge and material specification, connector part numbers (with AMP/Molex/TE Connectivity or equivalent), environmental requirements (temperature, vibration, IP rating), quality standard (IPC-A-620 Class), testing requirements (hipot, continuity, resistance).

Step 2: RFQ and Supplier Selection

Issue to minimum 3 India suppliers. Evaluate: current customer list (who else do they supply and at what quality level), certification status (IPC-A-620, IATF 16949, AS9100 as applicable), tooling capabilities (crimp press inventory, test equipment), and capacity availability.

Step 3: First Article and Process Qualification

First article inspection (FAI) per harness drawing. 100% dimensional and electrical check on first articles. Review process documentation: work instructions, crimp force monitoring records, operator certifications. Approve process before volume production begins.

Step 4: Production Approval and Ongoing Quality

Issue production purchase order with: AQL sampling plan for ongoing inspection, monthly quality scorecards (PPM defect rate, on-time delivery), annual process audit. India suppliers should achieve PPM below 500 for established programmes; world-class is below 50 PPM.

Lead Times and Logistics for India-Sourced Wire Harnesses

Standard production lead time from approved supplier: 4-6 weeks for standard programmes, 8-12 weeks for new programme with tooling. First article lead time from drawing release: 3-4 weeks.

Logistics: Wire harnesses are high-volume, low-density (bulky, light). Sea freight is preferred for annual programmes. India to US East Coast: 22-26 days. India to Europe: 16-20 days. For automotive JIT supply, airfreight supplements during ramp-up or expedites. Consider India-based bonded warehousing for volume programmes to reduce effective lead time to 1-2 weeks.

Cost Benchmarking: What to Expect from India Quotes

For a representative automotive door harness (40 circuits, 2.2m length, 180 terminals, USCAR-2 qualified):

  • China quote (Tier-2 manufacturer): $22-28 per assembly
  • Mexico quote (Tier-2 manufacturer): $26-34 per assembly
  • India quote (Tier-2 manufacturer): $14-19 per assembly

India is 30-40% cheaper than China on unit price before tariffs. With 25% Section 301 tariffs on Chinese wire harnesses, India’s landed cost advantage in the US market exceeds 50%.

Key Takeaways

  • Wire harness manufacturing is the highest-ROI India sourcing category: 30-40% lower unit cost than China, zero tariff exposure, established ecosystem.
  • India has tier-1 global harness manufacturers (Motherson) and a deep tier-2 contract manufacturing base for custom programmes.
  • IPC-A-620 (workmanship), USCAR-2 (automotive crimp), and AS9100 (aerospace) are the relevant quality standard triplet to specify.
  • Qualification from RFQ to first article approval: 6-10 weeks for standard harnesses.
  • India harnesses are not just cheaper – India’s established global automotive customer base (Toyota, VW, Honda) validates quality at production scale.

FAQs

Q: Can India suppliers handle complex aerospace wire harnesses with shielding, backshell connectors, and MIL-spec wire?

A: Yes – Bengaluru and Pune have AS9100-certified harness manufacturers experienced in MIL-W-22759 wire, MIL-C-26482 connectors, EMI backshell, and coaxial harness assemblies. Reference programmes include supply to Airbus, HAL, and DRDO. Qualification of a new aerospace harness programme typically takes 9-15 months including DFM, FAI, and first-flight approval.

Q: What is the minimum order quantity for India wire harness sourcing?

A: For custom harnesses, minimum economic order is approximately 500 pieces/year. Below that, tooling amortisation (crimp tooling, test fixture) makes India less competitive than domestic assembly. For standard harness assemblies using off-the-shelf connectors, even smaller quantities are viable.

Q: How do I manage harness design changes in an India-sourced programme?

A: Establish a formal engineering change control process with your India supplier: all drawing changes go through a change note with FAI trigger for dimensional or electrical changes. India suppliers with automotive experience have mature ECN processes. Budget 2-3 weeks for FAI on significant changes.

EV Manufacturing in India 2026: Battery Supply Chain, PLI Incentives, and OEM Entry Guide

Introduction

India’s electric vehicle transition has entered its industrial phase in 2026. Installed EV production capacity has crossed 2 million units per year. Battery cell manufacturing facilities backed by PLI – including Ola Electric, Amara Raja, Exide Industries, and Reliance New Energy – are now producing cells. The EV PLI scheme has committed Rs 18,100 Cr to accelerate local production. Global OEMs including BYD, Hyundai, and Tesla are either building or evaluating India EV manufacturing facilities.

For global supply chain executives, India’s EV ecosystem in 2026 offers two distinct opportunities: sourcing EV components from India for global programmes, and establishing India manufacturing for the Indian EV market. This guide maps both.

India EV Market in 2026: The Context

India is now the world’s third-largest EV market by two-wheeler and three-wheeler volume and the sixth-largest by passenger car EV sales. Key 2026 data points:

  • Two-wheeler EVs: 5.2 million units sold annually (36% of total two-wheeler market)
  • Three-wheeler EVs: 800,000 units (58% of total three-wheeler market)
  • Passenger car EVs: 520,000 units (8.5% of passenger car market – growing rapidly)
  • Commercial EV (buses, LCVs): 85,000 units
  • Total EV penetration by volume: 28% of all vehicles sold

The government’s FAME III scheme (successor to FAME II) is driving commercial and public transport electrification. State EV policies in Tamil Nadu, Maharashtra, Telangana, and Gujarat offer additional incentives. India’s EV trajectory is not aspirational – it is happening at scale.

Battery Cell Manufacturing: What Is Operational in 2026

Ola Electric – Krishnagiri, Tamil Nadu

Ola Electric’s Gigafactory (Phase 1) is producing lithium-ion cells (NMC chemistry, 4680 form factor) with 5 GWh annual capacity in 2026, ramping to 100 GWh by 2030. This is India’s first indigenous cell manufacturing at volume. Ola is vertically integrated – cells to battery packs to two-wheeler production at the same campus.

Amara Raja Energy & Mobility – Divitipalle, Telangana

Amara Raja’s Giga Corridor (Phase 1 operational 2025-2026) produces LFP (Lithium Iron Phosphate) cells targeting two-wheelers, three-wheelers, and commercial vehicles. LFP chemistry offers superior thermal safety and cycle life – preferred for high-temperature Indian operating conditions.

Reliance New Energy – Jamnagar, Gujarat

Reliance’s solar-integrated battery manufacturing facility is ramping in 2026, targeting large-format cells for stationary storage and commercial EV applications. Partnership with lithium cell technology provider for transfer of advanced cell manufacturing know-how.

Exide Industries – Multiple Locations

Exide’s Li-ion cell plant is operational in 2026, leveraging its existing lead-acid battery manufacturing and distribution network. Focus on two-wheeler and compact passenger car battery packs.

The EV Component Supply Chain: Where India Is Competitive Now

Battery Packs (BMS + Modules + Cells + Housing)

India has competitive battery pack assembly capability. Multiple tier-1 battery pack manufacturers (Tata AutoComp, Exide, Amara Raja, Epsilon Advanced Materials) supply OEMs. The bottleneck was cell supply – increasingly resolved by 2026 domestic cell production.

Electric Motors (PMSM, BLDC, Induction)

India has strong motor manufacturing capability: Bharat Bijlee, Mahindra CIE, HELLA India, and multiple tier-2 manufacturers produce PMSM and BLDC motors for two-wheelers, three-wheelers, and light commercial EVs. For passenger car EV motors (higher torque, higher precision requirements), qualification is needed but capability exists.

Power Electronics (Inverters, OBCs, DC-DC Converters)

India’s power electronics supply chain for EVs is developing. Companies like Tata Elxsi (design), KPIT Technologies (embedded), and a growing base of hardware manufacturers are building inverter and onboard charger capability. This is the most underdeveloped tier of India’s EV supply chain – significant gap and opportunity.

EV Structural Components (Battery Enclosures, Chassis, Subframes)

India’s established metal fabrication, casting, and forging capabilities directly apply to EV structural components. Battery enclosures in aluminium (die cast) and steel (stamped) are being produced at Bharat Forge, Sandhar Technologies, and multiple tier-2 stamping companies. This is a high-confidence supply area.

Thermal Management Systems

Heat exchangers, cooling plates, and thermal interface materials for battery systems – India has cooling system manufacturing capability but EV-specific thermal management is a developing niche. Global tier-1 suppliers (Valeo, Hanon Systems) are establishing India manufacturing to serve local OEMs.

PLI for Advanced Chemistry Cell (ACC) Battery Manufacturing

The PLI for Advanced Chemistry Cell Battery Manufacturing scheme (Rs 18,100 Cr) committed in 2021 and now in active production phase offers:

  • Incentive: 18-20% on net sales of ACC batteries above base year production
  • Qualifying capacity: Minimum 5 GWh per beneficiary
  • Duration: 5 years of incentives
  • Approved beneficiaries: Ola Electric, Amara Raja, Reliance New Energy, Rajesh Exports (later variants)

PLI incentive effect: At 18-20% on net sales, ACC PLI dramatically changes the economics of India battery production versus imported cells – effectively subsidising the ~25-30% cost premium India cells currently carry over Chinese cells at equivalent energy density.

How Global OEMs Are Entering India EV Manufacturing in 2026

Tesla Model Y – Pune Production

Tesla’s India assembly operation in Pune (CKD initially, progressing to SKD and local content ramp) began in 2025. India-produced Model Y targets the domestic market and serves as Tesla’s first Asia-Pacific manufacturing outside China. Components are progressively localised through an active India supplier development programme.

BYD – Pune Manufacturing JV

BYD’s India JV with Megha Engineering has received government approval and site selection is underway for a greenfield EV manufacturing facility targeting 100,000 units/year at full ramp. BYD brings its Blade Battery technology; the India JV enables competitive local pricing without import duties.

Hyundai and Kia – Tamil Nadu EV Expansion

Hyundai’s IONIQ 5 and IONIQ 6 are assembled at the Sriperumbudur plant with progressive localisation. Hyundai is the highest-volume premium EV player in India’s passenger car segment in 2026.

Key Takeaways

  • India’s EV transition is industrial-phase in 2026: cell manufacturing is operational, OEM assembly is scaling, and the supply chain is developing rapidly.
  • Battery cells, motor assemblies, structural components, and battery pack integration are India’s strongest EV supply chain capabilities in 2026.
  • Power electronics (inverters, OBCs) is the key supply chain gap – also the highest-margin opportunity for component manufacturers entering India.
  • PLI for ACC battery manufacturing (Rs 18,100 Cr) is actively disbursing and making India-produced cells increasingly cost-competitive.
  • Global OEMs establishing India EV manufacturing in 2026 are accessing one of the world’s fastest-growing EV markets with a full domestic supply chain advantage.

FAQ

Q: Are India-produced EV batteries competitive with Chinese cells on cost?

A: Not yet on pure cell-level cost – Chinese CATL and BYD Blade cells remain 15-20% cheaper at equivalent energy density. However, PLI incentives (18-20% on net sales), import duty savings, and logistics cost advantages make India-origin cells increasingly competitive for India-market applications and for export programmes where China-origin supply carries tariff exposure.

Q: What is the minimum order size for India EV component sourcing?

A: Battery pack integration: 500+ packs/year is commercially viable. Motor assemblies: 1,000+ units/year. Structural castings and stampings: 2,000+ units/year for economical tooling amortisation. Power electronics: most India suppliers are building capacity for 5,000+ units/year programmes.

Q: How does India EV manufacturing compare to China for export-oriented production?

A: India’s lower labour cost, zero-tariff access to US market (versus Chinese EVs facing 100%+ tariffs in 2026), and strengthening domestic supply chain make India increasingly competitive for export-oriented EV manufacturing targeted at the US, EU, and ASEAN markets.

India Semiconductor Manufacturing 2026: Fabs, OSAT, and the Supply Chain Opportunity

Introduction

In 2026, India’s semiconductor ambition has moved from policy document to construction site to operational facility. Micron’s OSAT plant in Sanand, Gujarat is packaging and testing DRAM and NAND chips. Tata Electronics’ semiconductor assembly and test facility in Jagiroad, Assam is operational. CG Power’s OSAT facility in Sanand is coming online. The Tata wafer fabrication facility in Dholera is in advanced construction. India is no longer a semiconductor aspiration – it is a semiconductor supply chain destination.

This article explains what is actually operational in 2026, what the capability boundaries are, what is coming in 2027-2028, and what it means for global electronics supply chains.

What Is Operational in India in 2026

Micron Technology – Sanand, Gujarat (OSAT)

Micron’s $2.75B OSAT (Outsourced Semiconductor Assembly and Test) facility began volume production in late 2025. The facility assembles and tests DRAM and NAND flash memory chips for global markets. At full ramp, it handles assembly, packaging, wafer probe, final test, and burn-in for memory devices destined for data centre, automotive, and consumer electronics applications.

Capability: Memory device OSAT only – DRAM and NAND. Not a logic or mixed-signal foundry. Capacity: ~450,000 wafer starts per month equivalent at full ramp. Strategic significance: This is the first major US semiconductor company to establish manufacturing in India.

Tata Electronics – Jagiroad, Assam (OSAT)

Tata’s first semiconductor facility, built in partnership with Powerchip Semiconductor Manufacturing Corporation (PSMC) of Taiwan, is operational for packaging and testing. The facility handles wafer bumping, flip-chip packaging, and test for mature-node logic chips and display drivers.

Capability: Mature-node chip packaging and test (28nm and above). Not a leading-edge logic fab. Capacity: Initial phase handling mid-tier volumes, ramping through 2026.

CG Power – Sanand, Gujarat (OSAT)

CG Power’s facility, developed in partnership with Renesas (Japan) and Stars Microelectronics (Thailand), focuses on automotive-grade and industrial semiconductor packaging. The facility targets IATF 16949-qualified automotive chip production – a critical gap given the 2021-2023 automotive chip shortage.

Capability: Automotive and industrial chip packaging (AEC-Q100 qualified). This is a strategically important capability differentiation.

The Dholera Fab: India’s First Wafer Fabrication Plant

Tata’s greenfield semiconductor wafer fabrication facility in Dholera Special Investment Region (Gujarat) – developed with PSMC – is under construction with first silicon expected in 2026-2027. Key parameters:

  • Node: 28nm and above (mature node) – not cutting-edge sub-5nm
  • Wafer size: 300mm
  • Target capacity: 50,000 wafer starts per month at full ramp
  • Target markets: Automotive ICs, power management, display drivers, microcontrollers, IoT devices
  • Investment: Rs 91,000 Cr (approximately $11B) with India Semiconductor Mission support

Strategic context: 28nm is the sweet spot for automotive, industrial, and consumer IoT applications. It is not competing with TSMC’s 3nm for AI chips – it is building India’s base in the semiconductor supply chain for the product categories India actually manufactures: cars, phones, industrial equipment.

What India’s Semiconductor Capability Means for Global Supply Chains in 2026

For Memory-Dependent Products: Immediate Benefit

Companies sourcing DRAM and NAND memory for products sold in the US or Europe can now specify India-origin packaging (Micron Sanand) to satisfy supply chain resilience and domestic content requirements. This is relevant for data centre equipment buyers, automotive electronics OEMs, and consumer electronics assemblers.

For Automotive Electronics: Emerging Benefit

CG Power’s Renesas-aligned OSAT provides AEC-Q100 qualified packaging for automotive chips. Companies building EV powertrains, ADAS systems, or vehicle body electronics who need to diversify away from Taiwan-concentrated automotive IC packaging have a new India option in 2026.

For Logic-Intensive Products (AI, High-Performance Computing): Not Yet

India has no leading-edge logic fab (sub-7nm). For AI accelerators, GPUs, and advanced mobile SoCs, TSMC Taiwan, Samsung Korea, and Intel Foundry remain the only options. India will not have leading-edge logic capability before 2030+ at the earliest.

The India Semiconductor Mission: Policy Support Through 2027

The India Semiconductor Mission (ISM) has committed Rs 76,000 Cr (approximately $9B) across three scheme windows:

  • Scheme A (Fab): 50% fiscal support for wafer fabrication facilities. Tata Dholera is the first beneficiary.
  • Scheme B (OSAT/ATMP): 50% fiscal support for assembly, testing, marking, and packaging. Micron, Tata, and CG Power are beneficiaries.
  • Scheme C (Compound Semiconductors/MEMS): 50% fiscal support for specialty semiconductor manufacturing. Several companies in advanced discussions.

The ISM has disbursed approximately Rs 18,000 Cr as of early 2026, with the remaining committed as facilities hit production milestones. The fiscal commitment is real and disbursed – not aspirational.

ECMS 2025 and the Component Ecosystem Around Semiconductors

The Electronics Component Manufacturing Scheme (ECMS 2025, Rs 22,919 Cr) targets the upstream component supply chain that semiconductor manufacturing requires: PCB substrates, advanced packaging materials, test socket components, and speciality chemicals. Several tier-1 component manufacturers from Japan, South Korea, and Taiwan have filed expressions of interest to establish India manufacturing under ECMS, attracted by PLI incentives and proximity to India’s growing semiconductor assembly base.

Key Takeaways

  • India has operational OSAT capability in 2026: Micron (memory), Tata Electronics (logic/display), and CG Power (automotive) are all producing.
  • Wafer fabrication (Tata Dholera, 28nm) is expected to yield first silicon in 2026-2027 – India is months, not years, away from domestic chip production.
  • India’s semiconductor capability is strongest in memory packaging, automotive-grade chips, and mature-node logic – the products that India’s growing electronics manufacturing base actually needs.
  • For leading-edge logic (AI chips, advanced mobile SoCs), India is not yet a supply option.
  • The India Semiconductor Mission’s Rs 76,000 Cr fiscal commitment is disbursing against production milestones – the money is real.

FAQ

Q: Can I source chips from India for my product in 2026?

A: For memory chips (DRAM, NAND): yes, Micron Sanand output. For automotive ICs (AEC-Q100): yes, CG Power Sanand. For general logic/microcontrollers from India-origin wafer fab: expected 2027+. For cutting-edge logic: not India in the foreseeable future.

Q: What does “OSAT” mean and how does it differ from a foundry?

A: A semiconductor foundry (like TSMC) fabricates chips from silicon wafers – it does the complex photolithography that creates transistors. An OSAT (Outsourced Semiconductor Assembly and Test) facility receives finished wafers from a foundry, cuts them into individual chips (dicing), packages them in protective housings, and tests them. India has OSAT facilities now; its first foundry is under construction.

Q: How does India semiconductor manufacturing interact with PLI for electronics?

A: India-origin components (including packaged semiconductors) can count toward domestic value addition requirements under PLI schemes, potentially increasing PLI incentives for electronics OEMs who source from Indian OSAT facilities. ECMS 2025 creates additional incentives for OSAT output consumed domestically.