Real-Time Production Visibility Dashboards vs Weekly Status Calls
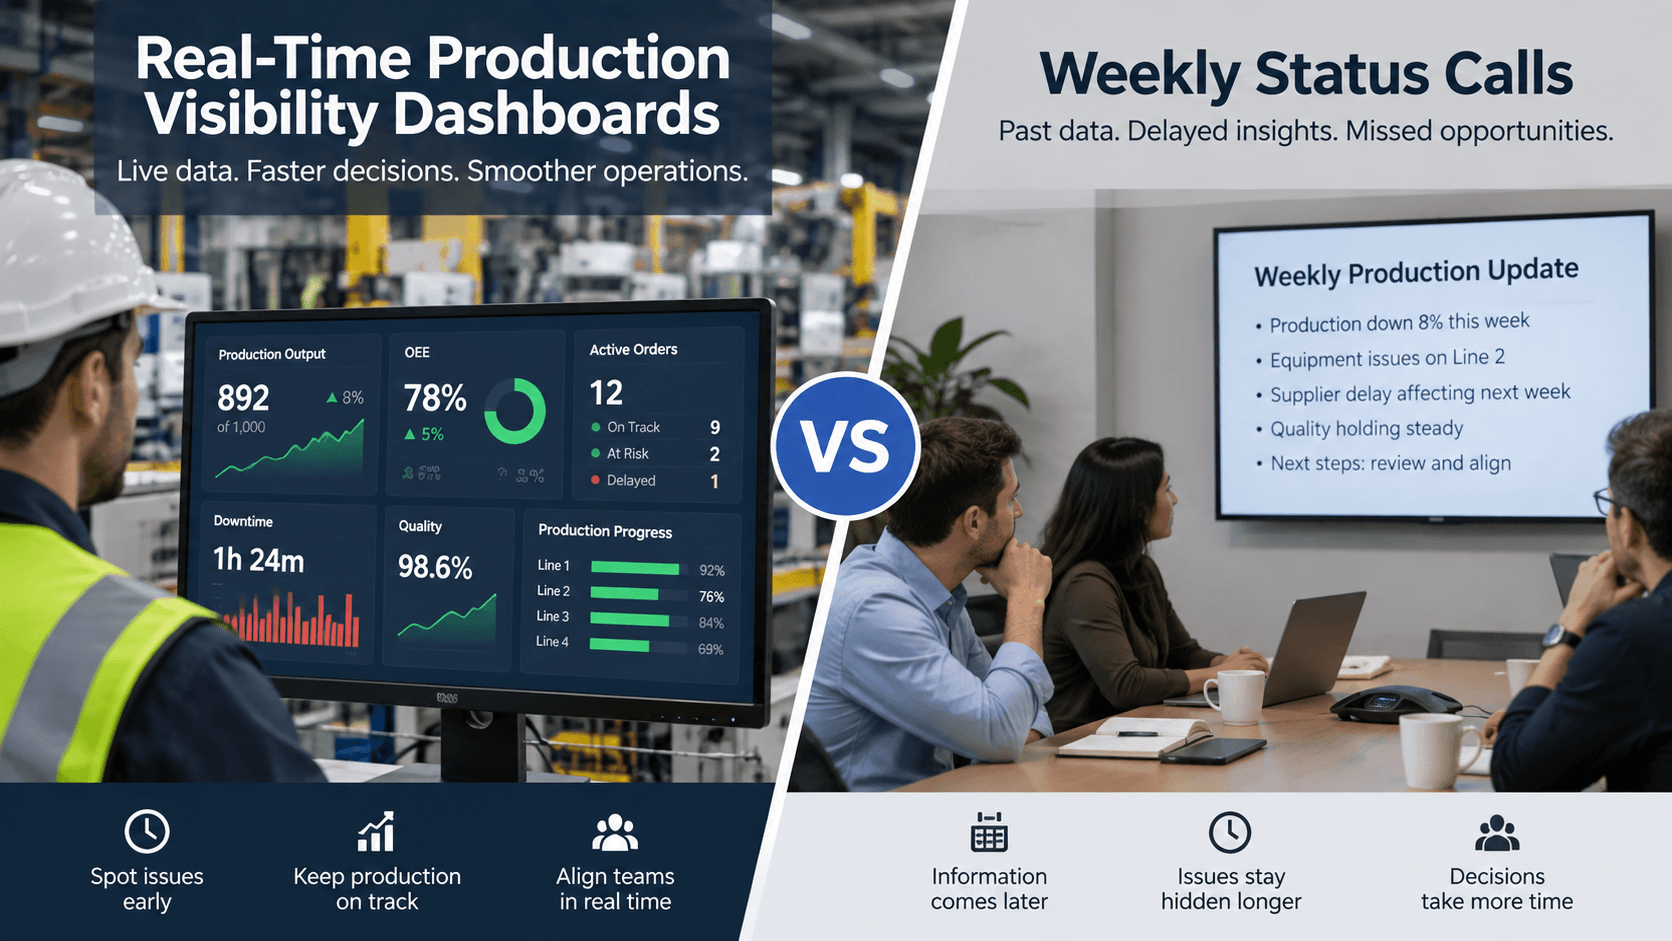
When production teams rely on weekly status calls, important changes can sit unnoticed for days. A real-time production visibility dashboard gives operations, plant managers, and leadership a shared view of what is happening now, helping teams spot delays, bottlenecks, and exceptions before they become larger problems.
Weekly calls still have value for discussion and decision-making. The problem is using them as the primary source of operational visibility.
Real-Time Dashboards vs. Weekly Status Calls
The key difference is simple: dashboards provide continuous visibility, while status calls provide periodic updates.
| Factor | Real-Time Production Dashboard | Weekly Status Call |
|---|---|---|
| Data availability | Continuous | Weekly or periodic |
| Issue detection | Near real time | Often delayed |
| Data source | Connected operational systems | Manually reported updates |
| Visibility | Shared across teams | Limited to participants |
| Response time | Minutes or hours | Days may pass |
| Historical analysis | Usually built in | Often requires manual records |
| Meeting dependency | Low | High |
| Best use | Monitoring and exception management | Discussion and decision-making |
A dashboard does not necessarily replace communication. Instead, it changes what teams need to communicate about.
The Problem With Weekly Production Updates
A weekly meeting creates a snapshot of operations. That can be useful, but manufacturing and production environments rarely stay static for an entire week.
A machine may go down on Monday. A supplier may miss a delivery on Tuesday. A quality issue may emerge Wednesday. By the time the issue appears in a Friday status call, the team may already have spent several days dealing with its consequences.
Manual reporting also introduces another challenge: information gets summarized before decision-makers see it.
A production manager might hear that a line is “slightly behind schedule” without immediately seeing:
- Which line is affected
- When the delay started
- How much output has been lost
- Which orders are at risk
- Whether the issue is recurring
- Who is responsible for the next action
The meeting can surface the problem, but it is not necessarily the best mechanism for discovering it.
What Real-Time Production Visibility Changes
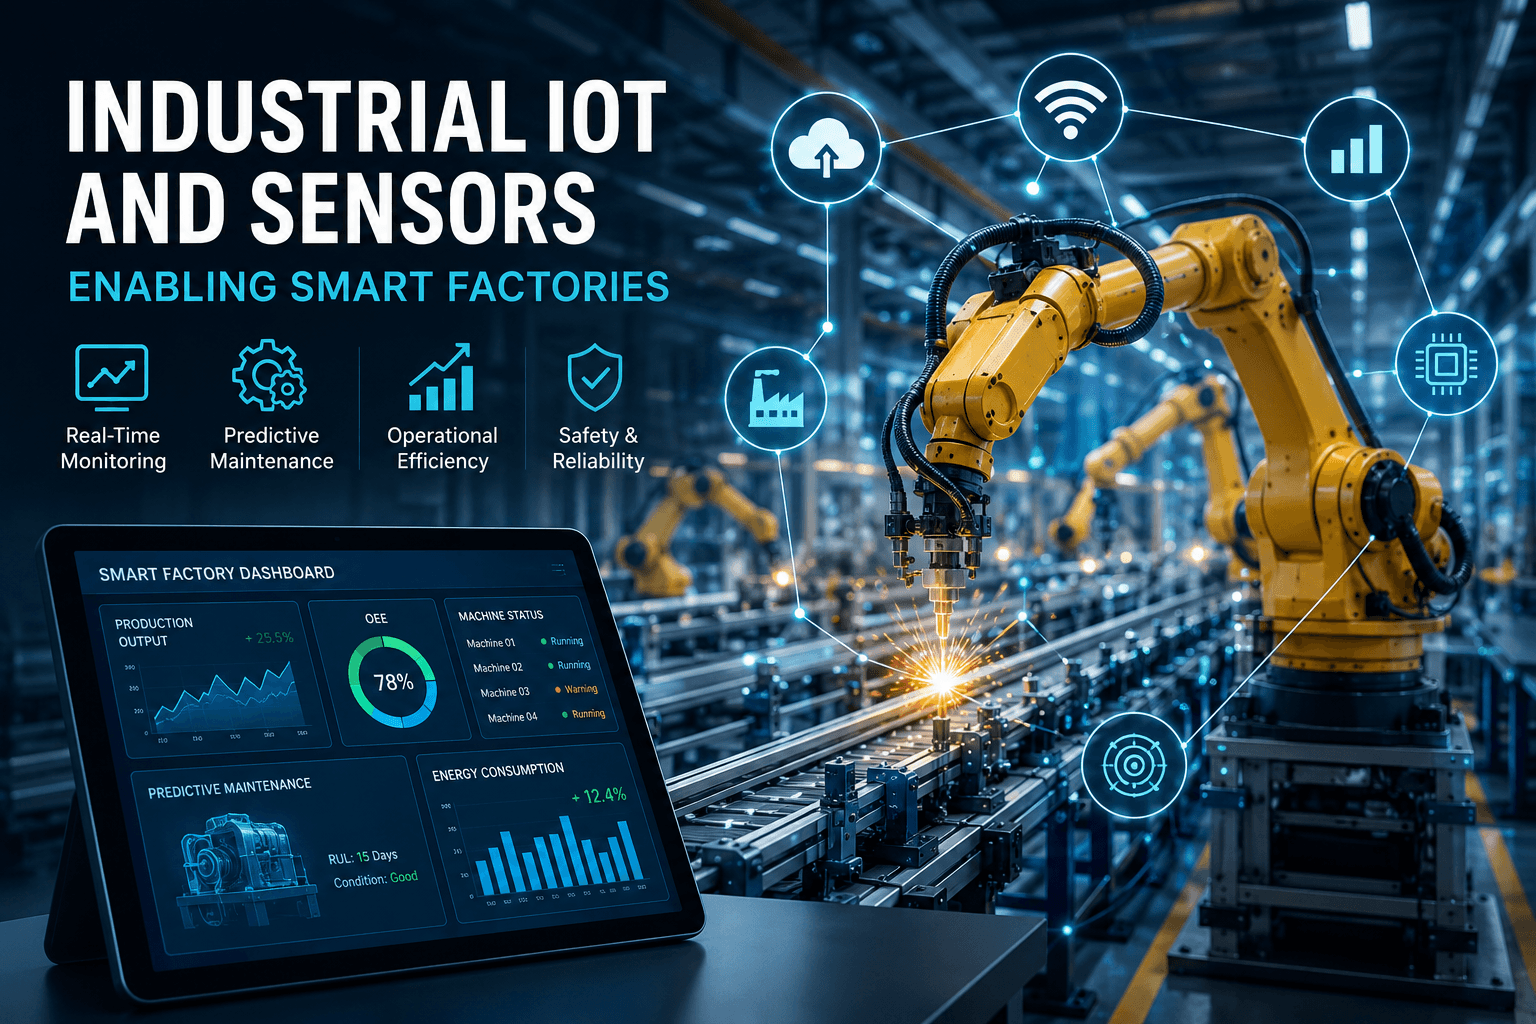
A production visibility dashboard brings operational information into one shared view.
Depending on the systems connected to it, teams can monitor metrics such as:
Production output
Compare actual production against planned output throughout a shift, day, or production period.
Downtime
See when equipment stops, how long it remains unavailable, and which assets experience repeated downtime.
Production schedules
Track planned versus actual progress and identify orders or batches that are falling behind.
Quality performance
Monitor defects, rework, scrap, and other quality indicators as production progresses.
Operational exceptions
Instead of asking managers to review every metric, dashboards can highlight conditions that require attention, such as an unexpected production drop or prolonged downtime.
This shifts the operating model from “What happened this week?” to “What needs attention right now?”
Dashboards and Status Calls Serve Different Purposes
It is tempting to frame this as a choice between technology and meetings. That misses the point.
The strongest production teams use both.
A dashboard answers questions such as:
- What is happening?
- Where is performance deviating from plan?
- When did the issue begin?
- How significant is the deviation?
- Is the problem isolated or recurring?
A status call is better suited to questions such as:
- Why did this happen?
- What should we do about it?
- Who owns the action?
- What decision needs leadership input?
- What resources are required?
In other words, the dashboard provides the evidence, while the meeting provides the context and decisions.
How Real-Time Visibility Improves Response Time
Consider a production line scheduled to produce 1,000 units during a shift.
With a weekly reporting process, the team may only learn later that the line consistently produced 850 units because of recurring equipment stoppages.
With real-time visibility, the production team can see the deviation while the shift is still running. Supervisors can investigate the cause, maintenance can respond, and operations can determine whether production needs to be rescheduled.
The value is not simply seeing a number sooner. It is having more time to act on that information.
The ROI of Moving Beyond Manual Reporting
The business case for production dashboards usually extends beyond faster reporting.
Less administrative work
Managers and supervisors spend less time collecting data, preparing spreadsheets, and assembling presentation updates.
Faster issue resolution
Problems can be identified closer to when they occur, reducing the time between detection and action.
Better accountability
A shared operational view makes it easier to understand which processes, assets, or work orders require attention.
More consistent decision-making
Teams work from the same data rather than relying on different spreadsheets, messages, or verbal updates.
Stronger continuous improvement
Historical dashboard data can help teams identify recurring bottlenecks and performance trends instead of treating every incident as an isolated event.
When Weekly Status Calls Still Make Sense
Weekly calls are not obsolete.
They remain useful for production reviews, cross-functional coordination, resource planning, and leadership decisions. They are particularly valuable when multiple teams need to discuss an issue that cannot be solved through monitoring alone.
The problem arises when the meeting is responsible for both collecting operational data and interpreting it.
A better approach is to collect and surface the data continuously, then use meetings to focus on exceptions, trends, and decisions.
A Better Production Operating Rhythm
Organizations moving from weekly reporting to real-time visibility do not need to eliminate meetings overnight.
A practical transition looks like this:
1. Automate data collection.
Connect relevant production, equipment, quality, inventory, or ERP systems where possible.
2. Define the metrics that matter.
Start with a focused set of operational KPIs rather than building a dashboard full of numbers nobody uses.
3. Establish exception thresholds.
Decide which conditions require investigation or escalation.
4. Give teams shared visibility.
Operators, supervisors, managers, and executives may need different views of the same underlying data.
5. Redesign the weekly meeting.
Use the dashboard as the starting point. Spend meeting time discussing significant deviations, root causes, decisions, and actions.
6. Measure the improvement.
Track reporting time, issue response time, downtime, schedule adherence, and other relevant operational outcomes.
The Bottom Line
Real-time production visibility dashboards and weekly status calls are not competing tools.
A weekly call tells you what the team believes happened during a reporting period. A real-time dashboard shows what is happening across operations as events unfold.
For production environments where delays, downtime, quality issues, and schedule changes can quickly affect costs and customer commitments, that difference matters.
The most effective model is usually real-time visibility for monitoring, combined with focused meetings for analysis and decisions. This gives teams less time spent gathering information and more time acting on it.