


Tolerance Stack-Up Analysis: Preventing Assembly Failures in Precision Builds
What Is Tolerance Stack-Up Analysis?
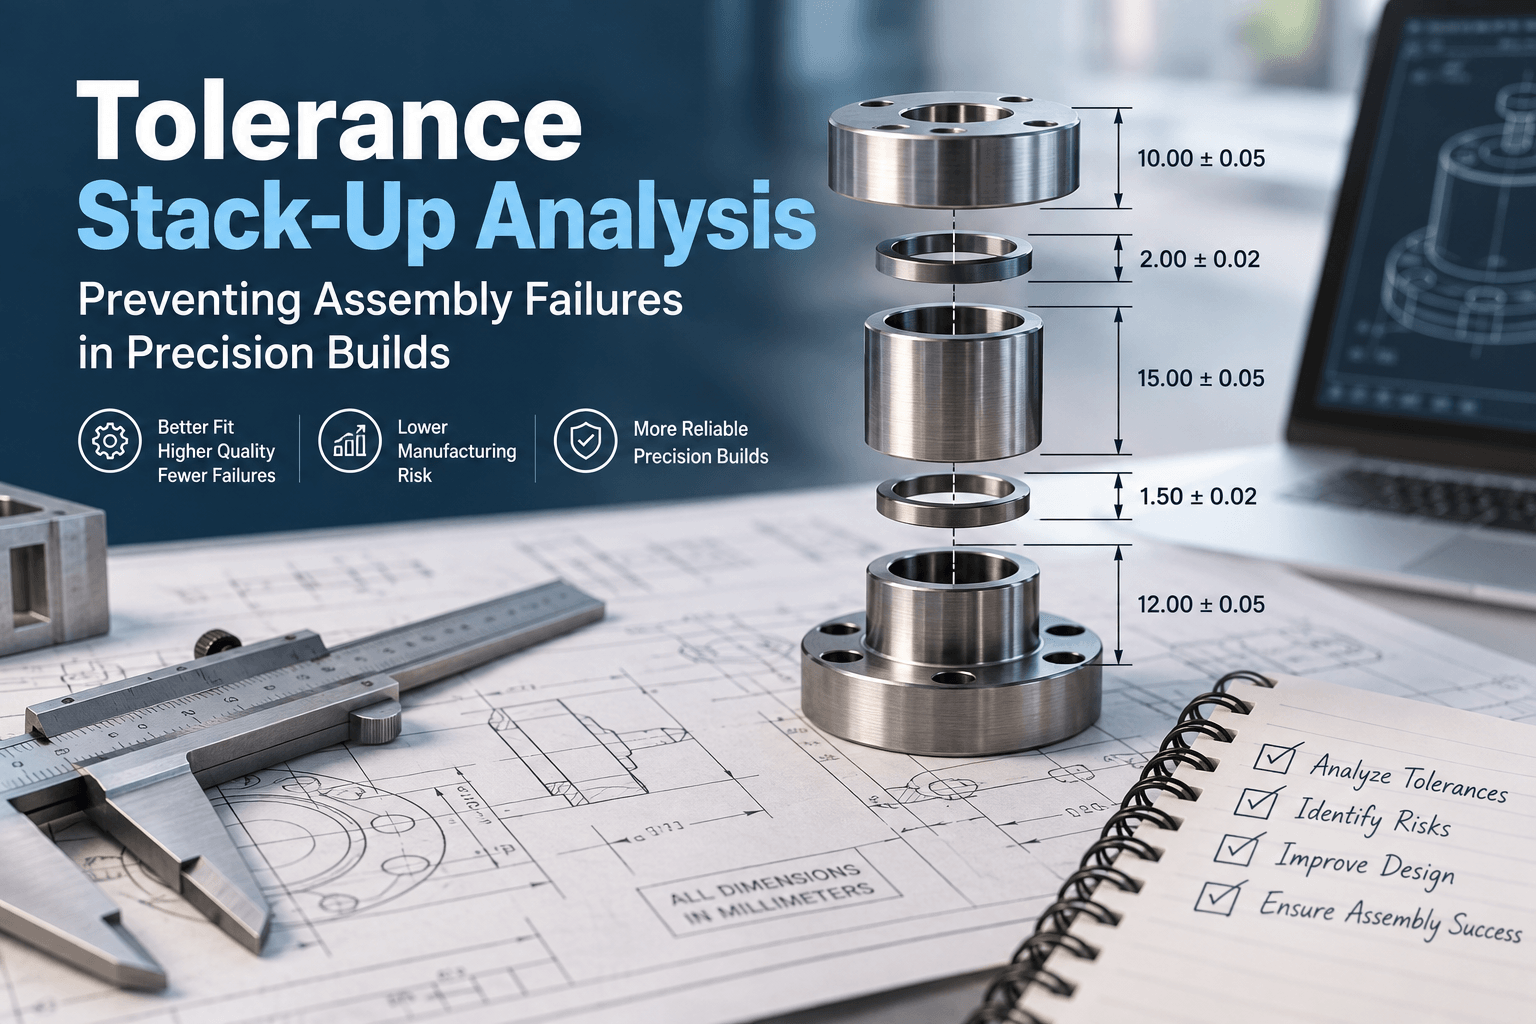
Tolerance stack-up analysis is the process of evaluating how individual part tolerances combine within an assembly. Even when every component falls within its specified tolerance, the final assembly can still have excessive variation.
This matters most in precision builds, where small dimensional changes can affect fit, alignment, motion, sealing, electrical contact, or overall product performance.
For example, consider an assembly with several components positioned along a common axis. Each part may have a tolerance of ±0.05 mm. The individual tolerances seem small, but when several dimensions contribute to the same functional requirement, their combined variation can become significant.
A tolerance stack-up analysis identifies that risk before parts reach production.
Why Tolerance Stack-Up Matters in Precision Manufacturing
Manufacturers often focus on whether individual components meet their drawings. That is necessary, but it does not always tell you whether the finished assembly will work.
A component can be within specification and still contribute to an assembly that is too tight, too loose, misaligned, or difficult to assemble.
Tolerance stack-up analysis helps engineering teams:
- Identify potential assembly failures before production
- Predict the range of possible assembly dimensions
- Determine whether tolerances are unnecessarily tight
- Improve fit and functional performance
- Reduce scrap, rework, and assembly delays
- Set realistic manufacturing requirements
- Find the dimensions that have the greatest impact on performance
The goal is not simply to make every tolerance smaller. Tight tolerances increase manufacturing cost and may reduce production flexibility. The better approach is to control the dimensions that actually affect the assembly’s critical functions.
The Two Main Types of Tolerance Stack-Up Analysis
Most tolerance stack-up studies use either worst-case analysis or statistical analysis. The right method depends on the application and the level of risk you are willing to accept.
Worst-Case Tolerance Analysis
Worst-case analysis assumes every contributing dimension reaches its most unfavorable tolerance limit at the same time.
For a simple linear stack:
Total variation = T₁ + T₂ + T₃ + … + Tₙ
If five dimensions each have a ±0.10 mm tolerance, the total possible variation is:
±0.50 mm
This approach is conservative because it assumes the least favorable combination of dimensions can occur.
Worst-case analysis is often appropriate when assembly failure has serious consequences or when interchangeability is essential.
Statistical Tolerance Analysis
Statistical analysis considers the probability distribution of dimensional variation rather than assuming every component reaches its extreme limit simultaneously.
For independent, normally distributed dimensions, a common approach is root-sum-square (RSS):
Total variation = √(T₁² + T₂² + T₃² + … + Tₙ²)
Using the same five ±0.10 mm contributors:
RSS = √(5 × 0.10²) ≈ 0.224 mm
That is considerably smaller than the ±0.50 mm worst-case result.
However, statistical analysis should not be used simply to justify looser tolerances. The underlying assumptions about distributions, process capability, independence, and production volume need to be realistic.
How to Perform a Tolerance Stack-Up Analysis
A structured process makes the analysis easier to review and less prone to missed contributors.
1. Define the Functional Requirement
Start with what the assembly needs to accomplish.
This could be:
- Minimum clearance between two components
- Maximum allowable shaft runout
- Required alignment between features
- Compression of a seal
- Position of a moving mechanism
- Electrical contact distance
- Bearing preload
- Total assembly height
The functional requirement becomes the target of the stack-up.
2. Identify the Critical Dimensions
Trace the dimensions that influence the functional requirement.
For a clearance calculation, for example:
Clearance = Housing width – Component width – Spacer thickness
Every dimension that can change this relationship belongs in the analysis.
Do not automatically include every dimension on the drawing. Focus on dimensions that have a physical relationship to the requirement being evaluated.
3. Establish the Tolerance Chain
Create a clear dimensional chain from one reference point to another.
A useful tolerance chain shows:
Datum → Dimension → Feature → Dimension → Feature → Functional Requirement
This makes it easier to identify missing contributors and understand how each tolerance affects the final result.
4. Assign the Correct Direction
Not every dimension contributes to variation in the same direction.
Some dimensions increase the functional gap, while others decrease it.
For example:
Clearance = A – B + C – D
The signs matter. Treating every tolerance as additive can produce an incorrect result.
5. Calculate the Stack
For a simple worst-case calculation:
Tₛ = |T₁| + |T₂| + |T₃| + …
For an RSS calculation:
Tₛ = √(T₁² + T₂² + T₃² + …)
The calculation should then be compared with the allowable functional tolerance.
6. Compare the Result With the Assembly Requirement
Suppose a mechanism requires between 0.20 mm and 0.50 mm of clearance.
If the calculated assembly range is 0.05 mm to 0.65 mm, the design does not meet its requirement across the full tolerance range.
That is the point at which the engineering team can investigate alternatives.
7. Find the Biggest Contributors
A stack-up analysis should not end with a pass or fail result.
Identify which dimensions contribute most to the variation. These are the best candidates for redesign, tighter process control, better datum schemes, or alternative manufacturing methods.
Tolerance Stack-Up Example
Consider a simple three-part assembly where the final axial position depends on three dimensions:
- Part A: 20.00 ± 0.05 mm
- Spacer: 5.00 ± 0.03 mm
- Part B: 10.00 ± 0.04 mm
The nominal stack is:
20.00 + 5.00 + 10.00 = 35.00 mm
Under worst-case conditions, the total tolerance is:
±(0.05 + 0.03 + 0.04) = ±0.12 mm
So the assembly could range from:
34.88 mm to 35.12 mm
If the functional requirement allows only 34.95 mm to 35.05 mm, the current tolerance scheme is not sufficient.
The next question should not automatically be, “Which tolerance should we tighten?”
Instead, engineers should determine which dimension has the strongest functional influence and whether the design can be changed to make the assembly less sensitive to variation.
Common Causes of Assembly Failures
Tolerance problems are not always caused by overly generous numerical tolerances. The underlying design and manufacturing approach also matters.
Poor Datum Selection
A tolerance may look reasonable relative to one reference but create significant variation when the assembly is actually located from another feature.
Datum selection should reflect how parts are manufactured, inspected, located, and assembled.
Long Tolerance Chains
Every additional contributing dimension creates another source of variation.
Reducing the number of dimensions in a functional chain can sometimes improve assembly consistency without requiring tighter tolerances.
Ignoring Geometric Tolerances
Size tolerances alone do not fully describe how a component will behave in an assembly.
Position, perpendicularity, parallelism, flatness, concentricity-related controls, profile, and other geometric tolerances can influence functional variation.
For precision assemblies, geometric dimensioning and tolerancing (GD&T) often provides a more realistic representation of how features can vary.
Designing Around Nominal Dimensions
An assembly that works perfectly at nominal dimensions is not necessarily a robust design.
The important question is whether it continues to work across realistic manufacturing variation.
Assuming Statistical Independence
Statistical stack-up methods can become misleading when dimensions are correlated.
For example, multiple features produced in the same operation may share process variation. Treating them as completely independent can underestimate the actual assembly variation.
How to Reduce Tolerance Stack-Up Problems
Once a stack-up reveals a problem, there are several ways to address it.
Reduce the Number of Contributors
Look for opportunities to eliminate unnecessary interfaces or dimensions from the functional chain.
A simpler dimensional chain is usually easier to manufacture, inspect, and control.
Improve the Datum Structure
Make sure the part is located from references that correspond to its actual assembly function.
A well-designed datum structure can reduce positional variation without requiring extremely tight individual tolerances.
Tighten Only Critical Tolerances
Avoid tightening every dimension.
Instead, identify the dimensions with the greatest sensitivity to the functional requirement. Tightening those dimensions can deliver a larger improvement for less manufacturing cost.
Introduce Adjustment or Compensation
Some assemblies can accommodate variation through shims, spacers, adjustment mechanisms, selective assembly, or compliant features.
This can be more economical than imposing extremely tight tolerances on every component.
Improve Process Capability
If a tolerance is technically achievable but production frequently approaches its limits, the problem may be process capability rather than the drawing tolerance itself.
Manufacturing teams can investigate tooling, fixturing, machine capability, measurement systems, and process controls.
Tolerance Stack-Up and GD&T
GD&T becomes particularly important when the assembly’s function depends on feature location or orientation rather than size alone.
For example, a shaft may have the correct diameter but still fail to assemble correctly if its axis is significantly displaced from the intended location.
Similarly, two holes can both have acceptable diameters but fail to align because their positions vary.
A robust tolerance analysis therefore considers the actual functional geometry of the assembly, not just a chain of linear dimensions.
Tools for Tolerance Stack-Up Analysis
Simple assemblies can often be analyzed with a spreadsheet. More complex designs may benefit from dedicated tolerance analysis software integrated with CAD.
Regardless of the tool, the important inputs remain the same:
- Functional requirement
- Nominal dimensions
- Dimensional tolerances
- GD&T controls
- Datum structure
- Assembly sequence
- Manufacturing process
- Variation assumptions
- Required confidence or risk level
Software can make calculations faster, but it cannot compensate for an incorrect tolerance chain or unrealistic assumptions.
Best Practices for Precision Builds
A reliable tolerance stack-up process should:
- Start with the functional requirement.
- Build the dimensional chain from the actual assembly datums.
- Include relevant geometric tolerances.
- Separate critical and non-critical dimensions.
- Use worst-case analysis when guaranteed limits matter.
- Use statistical methods only when their assumptions are justified.
- Identify the largest contributors to variation.
- Validate important assumptions with manufacturing data.
- Consider assembly methods and inspection capability.
- Revisit the analysis when the design or manufacturing process changes.
The best tolerance scheme is rarely the one with the smallest numbers. It is the one that delivers reliable assembly performance at an economically realistic manufacturing cost.
Final Thoughts
Tolerance stack-up analysis gives engineering teams a way to predict assembly variation before it becomes a production problem.
For precision builds, that early visibility can make a significant difference. Instead of discovering fit and alignment issues during assembly, engineers can identify the critical dimensions, understand their combined effect, and make targeted design or process changes.
The key is to analyze tolerances in the context of function. A component drawing may tell you whether an individual part is acceptable, but the stack-up tells you whether the parts will work together.