EV Manufacturing in India 2026: Battery Supply Chain, PLI Incentives, and OEM Entry Guide

Introduction

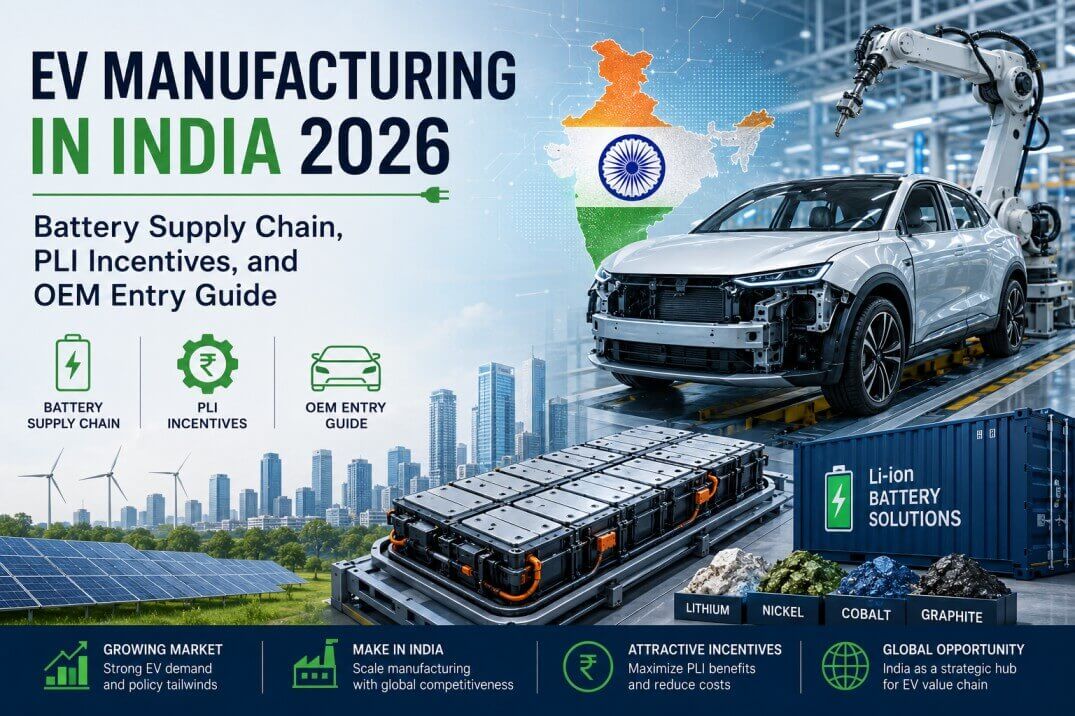
India’s electric vehicle transition has entered its industrial phase in 2026. Installed EV production capacity has crossed 2 million units per year. Battery cell manufacturing facilities backed by PLI – including Ola Electric, Amara Raja, Exide Industries, and Reliance New Energy – are now producing cells. The EV PLI scheme has committed Rs 18,100 Cr to accelerate local production. Global OEMs including BYD, Hyundai, and Tesla are either building or evaluating India EV manufacturing facilities.

For global supply chain executives, India’s EV ecosystem in 2026 offers two distinct opportunities: sourcing EV components from India for global programmes, and establishing India manufacturing for the Indian EV market. This guide maps both.

India EV Market in 2026: The Context

India is now the world’s third-largest EV market by two-wheeler and three-wheeler volume and the sixth-largest by passenger car EV sales. Key 2026 data points:

  • Two-wheeler EVs: 5.2 million units sold annually (36% of total two-wheeler market)
  • Three-wheeler EVs: 800,000 units (58% of total three-wheeler market)
  • Passenger car EVs: 520,000 units (8.5% of passenger car market – growing rapidly)
  • Commercial EV (buses, LCVs): 85,000 units
  • Total EV penetration by volume: 28% of all vehicles sold

The government’s FAME III scheme (successor to FAME II) is driving commercial and public transport electrification. State EV policies in Tamil Nadu, Maharashtra, Telangana, and Gujarat offer additional incentives. India’s EV trajectory is not aspirational – it is happening at scale.

Battery Cell Manufacturing: What Is Operational in 2026

Ola Electric – Krishnagiri, Tamil Nadu

Ola Electric’s Gigafactory (Phase 1) is producing lithium-ion cells (NMC chemistry, 4680 form factor) with 5 GWh annual capacity in 2026, ramping to 100 GWh by 2030. This is India’s first indigenous cell manufacturing at volume. Ola is vertically integrated – cells to battery packs to two-wheeler production at the same campus.

Amara Raja Energy & Mobility – Divitipalle, Telangana

Amara Raja’s Giga Corridor (Phase 1 operational 2025-2026) produces LFP (Lithium Iron Phosphate) cells targeting two-wheelers, three-wheelers, and commercial vehicles. LFP chemistry offers superior thermal safety and cycle life – preferred for high-temperature Indian operating conditions.

Reliance New Energy – Jamnagar, Gujarat

Reliance’s solar-integrated battery manufacturing facility is ramping in 2026, targeting large-format cells for stationary storage and commercial EV applications. Partnership with lithium cell technology provider for transfer of advanced cell manufacturing know-how.

Exide Industries – Multiple Locations

Exide’s Li-ion cell plant is operational in 2026, leveraging its existing lead-acid battery manufacturing and distribution network. Focus on two-wheeler and compact passenger car battery packs.

The EV Component Supply Chain: Where India Is Competitive Now

Battery Packs (BMS + Modules + Cells + Housing)

India has competitive battery pack assembly capability. Multiple tier-1 battery pack manufacturers (Tata AutoComp, Exide, Amara Raja, Epsilon Advanced Materials) supply OEMs. The bottleneck was cell supply – increasingly resolved by 2026 domestic cell production.

Electric Motors (PMSM, BLDC, Induction)

India has strong motor manufacturing capability: Bharat Bijlee, Mahindra CIE, HELLA India, and multiple tier-2 manufacturers produce PMSM and BLDC motors for two-wheelers, three-wheelers, and light commercial EVs. For passenger car EV motors (higher torque, higher precision requirements), qualification is needed but capability exists.

Power Electronics (Inverters, OBCs, DC-DC Converters)

India’s power electronics supply chain for EVs is developing. Companies like Tata Elxsi (design), KPIT Technologies (embedded), and a growing base of hardware manufacturers are building inverter and onboard charger capability. This is the most underdeveloped tier of India’s EV supply chain – significant gap and opportunity.

EV Structural Components (Battery Enclosures, Chassis, Subframes)

India’s established metal fabrication, casting, and forging capabilities directly apply to EV structural components. Battery enclosures in aluminium (die cast) and steel (stamped) are being produced at Bharat Forge, Sandhar Technologies, and multiple tier-2 stamping companies. This is a high-confidence supply area.

Thermal Management Systems

Heat exchangers, cooling plates, and thermal interface materials for battery systems – India has cooling system manufacturing capability but EV-specific thermal management is a developing niche. Global tier-1 suppliers (Valeo, Hanon Systems) are establishing India manufacturing to serve local OEMs.

PLI for Advanced Chemistry Cell (ACC) Battery Manufacturing

The PLI for Advanced Chemistry Cell Battery Manufacturing scheme (Rs 18,100 Cr) committed in 2021 and now in active production phase offers:

  • Incentive: 18-20% on net sales of ACC batteries above base year production
  • Qualifying capacity: Minimum 5 GWh per beneficiary
  • Duration: 5 years of incentives
  • Approved beneficiaries: Ola Electric, Amara Raja, Reliance New Energy, Rajesh Exports (later variants)

PLI incentive effect: At 18-20% on net sales, ACC PLI dramatically changes the economics of India battery production versus imported cells – effectively subsidising the ~25-30% cost premium India cells currently carry over Chinese cells at equivalent energy density.

How Global OEMs Are Entering India EV Manufacturing in 2026

Tesla Model Y – Pune Production

Tesla’s India assembly operation in Pune (CKD initially, progressing to SKD and local content ramp) began in 2025. India-produced Model Y targets the domestic market and serves as Tesla’s first Asia-Pacific manufacturing outside China. Components are progressively localised through an active India supplier development programme.

BYD – Pune Manufacturing JV

BYD’s India JV with Megha Engineering has received government approval and site selection is underway for a greenfield EV manufacturing facility targeting 100,000 units/year at full ramp. BYD brings its Blade Battery technology; the India JV enables competitive local pricing without import duties.

Hyundai and Kia – Tamil Nadu EV Expansion

Hyundai’s IONIQ 5 and IONIQ 6 are assembled at the Sriperumbudur plant with progressive localisation. Hyundai is the highest-volume premium EV player in India’s passenger car segment in 2026.

Key Takeaways

  • India’s EV transition is industrial-phase in 2026: cell manufacturing is operational, OEM assembly is scaling, and the supply chain is developing rapidly.
  • Battery cells, motor assemblies, structural components, and battery pack integration are India’s strongest EV supply chain capabilities in 2026.
  • Power electronics (inverters, OBCs) is the key supply chain gap – also the highest-margin opportunity for component manufacturers entering India.
  • PLI for ACC battery manufacturing (Rs 18,100 Cr) is actively disbursing and making India-produced cells increasingly cost-competitive.
  • Global OEMs establishing India EV manufacturing in 2026 are accessing one of the world’s fastest-growing EV markets with a full domestic supply chain advantage.

FAQ

Q: Are India-produced EV batteries competitive with Chinese cells on cost?

A: Not yet on pure cell-level cost – Chinese CATL and BYD Blade cells remain 15-20% cheaper at equivalent energy density. However, PLI incentives (18-20% on net sales), import duty savings, and logistics cost advantages make India-origin cells increasingly competitive for India-market applications and for export programmes where China-origin supply carries tariff exposure.

Q: What is the minimum order size for India EV component sourcing?

A: Battery pack integration: 500+ packs/year is commercially viable. Motor assemblies: 1,000+ units/year. Structural castings and stampings: 2,000+ units/year for economical tooling amortisation. Power electronics: most India suppliers are building capacity for 5,000+ units/year programmes.

Q: How does India EV manufacturing compare to China for export-oriented production?

A: India’s lower labour cost, zero-tariff access to US market (versus Chinese EVs facing 100%+ tariffs in 2026), and strengthening domestic supply chain make India increasingly competitive for export-oriented EV manufacturing targeted at the US, EU, and ASEAN markets.

India Semiconductor Manufacturing 2026: Fabs, OSAT, and the Supply Chain Opportunity

Introduction

In 2026, India’s semiconductor ambition has moved from policy document to construction site to operational facility. Micron’s OSAT plant in Sanand, Gujarat is packaging and testing DRAM and NAND chips. Tata Electronics’ semiconductor assembly and test facility in Jagiroad, Assam is operational. CG Power’s OSAT facility in Sanand is coming online. The Tata wafer fabrication facility in Dholera is in advanced construction. India is no longer a semiconductor aspiration – it is a semiconductor supply chain destination.

This article explains what is actually operational in 2026, what the capability boundaries are, what is coming in 2027-2028, and what it means for global electronics supply chains.

What Is Operational in India in 2026

Micron Technology – Sanand, Gujarat (OSAT)

Micron’s $2.75B OSAT (Outsourced Semiconductor Assembly and Test) facility began volume production in late 2025. The facility assembles and tests DRAM and NAND flash memory chips for global markets. At full ramp, it handles assembly, packaging, wafer probe, final test, and burn-in for memory devices destined for data centre, automotive, and consumer electronics applications.

Capability: Memory device OSAT only – DRAM and NAND. Not a logic or mixed-signal foundry. Capacity: ~450,000 wafer starts per month equivalent at full ramp. Strategic significance: This is the first major US semiconductor company to establish manufacturing in India.

Tata Electronics – Jagiroad, Assam (OSAT)

Tata’s first semiconductor facility, built in partnership with Powerchip Semiconductor Manufacturing Corporation (PSMC) of Taiwan, is operational for packaging and testing. The facility handles wafer bumping, flip-chip packaging, and test for mature-node logic chips and display drivers.

Capability: Mature-node chip packaging and test (28nm and above). Not a leading-edge logic fab. Capacity: Initial phase handling mid-tier volumes, ramping through 2026.

CG Power – Sanand, Gujarat (OSAT)

CG Power’s facility, developed in partnership with Renesas (Japan) and Stars Microelectronics (Thailand), focuses on automotive-grade and industrial semiconductor packaging. The facility targets IATF 16949-qualified automotive chip production – a critical gap given the 2021-2023 automotive chip shortage.

Capability: Automotive and industrial chip packaging (AEC-Q100 qualified). This is a strategically important capability differentiation.

The Dholera Fab: India’s First Wafer Fabrication Plant

Tata’s greenfield semiconductor wafer fabrication facility in Dholera Special Investment Region (Gujarat) – developed with PSMC – is under construction with first silicon expected in 2026-2027. Key parameters:

  • Node: 28nm and above (mature node) – not cutting-edge sub-5nm
  • Wafer size: 300mm
  • Target capacity: 50,000 wafer starts per month at full ramp
  • Target markets: Automotive ICs, power management, display drivers, microcontrollers, IoT devices
  • Investment: Rs 91,000 Cr (approximately $11B) with India Semiconductor Mission support

Strategic context: 28nm is the sweet spot for automotive, industrial, and consumer IoT applications. It is not competing with TSMC’s 3nm for AI chips – it is building India’s base in the semiconductor supply chain for the product categories India actually manufactures: cars, phones, industrial equipment.

What India’s Semiconductor Capability Means for Global Supply Chains in 2026

For Memory-Dependent Products: Immediate Benefit

Companies sourcing DRAM and NAND memory for products sold in the US or Europe can now specify India-origin packaging (Micron Sanand) to satisfy supply chain resilience and domestic content requirements. This is relevant for data centre equipment buyers, automotive electronics OEMs, and consumer electronics assemblers.

For Automotive Electronics: Emerging Benefit

CG Power’s Renesas-aligned OSAT provides AEC-Q100 qualified packaging for automotive chips. Companies building EV powertrains, ADAS systems, or vehicle body electronics who need to diversify away from Taiwan-concentrated automotive IC packaging have a new India option in 2026.

For Logic-Intensive Products (AI, High-Performance Computing): Not Yet

India has no leading-edge logic fab (sub-7nm). For AI accelerators, GPUs, and advanced mobile SoCs, TSMC Taiwan, Samsung Korea, and Intel Foundry remain the only options. India will not have leading-edge logic capability before 2030+ at the earliest.

The India Semiconductor Mission: Policy Support Through 2027

The India Semiconductor Mission (ISM) has committed Rs 76,000 Cr (approximately $9B) across three scheme windows:

  • Scheme A (Fab): 50% fiscal support for wafer fabrication facilities. Tata Dholera is the first beneficiary.
  • Scheme B (OSAT/ATMP): 50% fiscal support for assembly, testing, marking, and packaging. Micron, Tata, and CG Power are beneficiaries.
  • Scheme C (Compound Semiconductors/MEMS): 50% fiscal support for specialty semiconductor manufacturing. Several companies in advanced discussions.

The ISM has disbursed approximately Rs 18,000 Cr as of early 2026, with the remaining committed as facilities hit production milestones. The fiscal commitment is real and disbursed – not aspirational.

ECMS 2025 and the Component Ecosystem Around Semiconductors

The Electronics Component Manufacturing Scheme (ECMS 2025, Rs 22,919 Cr) targets the upstream component supply chain that semiconductor manufacturing requires: PCB substrates, advanced packaging materials, test socket components, and speciality chemicals. Several tier-1 component manufacturers from Japan, South Korea, and Taiwan have filed expressions of interest to establish India manufacturing under ECMS, attracted by PLI incentives and proximity to India’s growing semiconductor assembly base.

Key Takeaways

  • India has operational OSAT capability in 2026: Micron (memory), Tata Electronics (logic/display), and CG Power (automotive) are all producing.
  • Wafer fabrication (Tata Dholera, 28nm) is expected to yield first silicon in 2026-2027 – India is months, not years, away from domestic chip production.
  • India’s semiconductor capability is strongest in memory packaging, automotive-grade chips, and mature-node logic – the products that India’s growing electronics manufacturing base actually needs.
  • For leading-edge logic (AI chips, advanced mobile SoCs), India is not yet a supply option.
  • The India Semiconductor Mission’s Rs 76,000 Cr fiscal commitment is disbursing against production milestones – the money is real.

FAQ

Q: Can I source chips from India for my product in 2026?

A: For memory chips (DRAM, NAND): yes, Micron Sanand output. For automotive ICs (AEC-Q100): yes, CG Power Sanand. For general logic/microcontrollers from India-origin wafer fab: expected 2027+. For cutting-edge logic: not India in the foreseeable future.

Q: What does “OSAT” mean and how does it differ from a foundry?

A: A semiconductor foundry (like TSMC) fabricates chips from silicon wafers – it does the complex photolithography that creates transistors. An OSAT (Outsourced Semiconductor Assembly and Test) facility receives finished wafers from a foundry, cuts them into individual chips (dicing), packages them in protective housings, and tests them. India has OSAT facilities now; its first foundry is under construction.

Q: How does India semiconductor manufacturing interact with PLI for electronics?

A: India-origin components (including packaged semiconductors) can count toward domestic value addition requirements under PLI schemes, potentially increasing PLI incentives for electronics OEMs who source from Indian OSAT facilities. ECMS 2025 creates additional incentives for OSAT output consumed domestically.

US Tariffs 2026 and Manufacturing Relocation: Which Categories Should Move to India Now

Introduction

In 2026, the us tariff calculus for US importers has been reset again. The re-escalation of Section 301 tariffs under the new US trade policy framework – with effective rates on Chinese electronics now exceeding 145% on selected HTS codes – has eliminated the economics of China-origin sourcing across a broad set of product categories. The question facing every procurement team, CFO, and supply chain executive is no longer “should we diversify?” but “which categories should move now, to where, and how fast?”

This guide maps the highest-impact tariff categories, scores India’s readiness for each, and gives you a practical relocation decision framework for 2026.

The 2026 Tariff Landscape: What Changed

The 2025-2026 tariff escalation built on the Section 301 framework but added new product-level specificity. Key changes impacting manufacturing sourcing decisions:

  • Electronics and semiconductors: Effective rates on Chinese-origin electronics assemblies now range from 25% to 145% depending on HTS classification and product category.
  • Industrial machinery: Broad tariff application to CNC machine tools, motors, pumps, and compressors from China at 25% base rates.
  • Automotive components: 25% duties on most Chinese-origin auto parts, adding $300-800 per vehicle on China-sourced BOM.
  • Textiles and apparel: Sector-specific rates targeting garments, technical textiles, and industrial fabrics.
  • Medical devices: New tariff scrutiny on Class I and Class II Chinese-origin medical devices and sub-components.

The net effect: for any product where China-origin tariffs exceed 15-20%, the TCO advantage of Chinese manufacturing is partially or fully offset. At 25%+ tariffs, India is decisively cheaper on total landed cost for labour-intensive categories.

Category-by-Category Relocation Assessment

Electronics Assembly and EMS – Move Now

Tariff exposure: 25-145% on Chinese-origin electronics. India readiness: High. India’s EMS ecosystem (Foxconn, Tata Electronics, Jabil India, Zetwerk-network CMs) handles SMT assembly, system-level integration, and testing to IPC-A-610 Class 2/3 standards. Apple’s India-origin iPhone now accounts for over 18% of global production. The ecosystem is validated, scalable, and tariff-advantaged.

Decision: Immediate qualification of Indian EMS suppliers for any electronics assembly with 2026 China tariff exposure above 20%.

Wire Harnesses and Cable Assemblies – Move Now

Tariff exposure: 25% Section 301. India readiness: Very High. Wire harness manufacturing is the most labour-intensive automotive sub-assembly – and India’s wage advantage is most decisive here. Major automotive wire harness manufacturers (Motherson, Pricol, Minda) have established, export-oriented facilities. India is already a global wire harness export hub; the question is only supplier selection.

Forged and Cast Components – Move Now

Tariff exposure: 25% on most ferrous forgings and castings. India readiness: Very High. India is the world’s second-largest forging producer. Rajkot, Ludhiana, and Pune clusters supply European and US industrial OEMs. Investment casting, sand casting, and die casting ecosystems are export-mature. No ramp risk for qualified buyers.

Precision Machined Components – Move Now

Tariff exposure: 25% on most CNC-machined components. India readiness: High. Tier-2 and Tier-3 precision machining clusters in Pune, Coimbatore, and Bengaluru supply to aerospace, automotive, and industrial OEMs. AS9100, IATF 16949, and ISO 9001 certification coverage is strong.

Injection Moulded Plastic Parts – Move with Qualification

Tariff exposure: 25%. India readiness: Medium-High. India has a growing injection moulding industry but limited cosmetic-grade mould capability for consumer electronics. For industrial and automotive plastic parts, India is competitive. For high-gloss consumer-grade plastics, some tooling may still run in China with India assembly.

Semiconductor Devices – Move in 2-3 Years

Tariff exposure: Up to 145% on Chinese-origin semiconductors. India readiness: Developing. Micron’s OSAT facility in Gujarat (operational 2025) and Tata’s planned semiconductor fab (Dholera, 2026-2027) are progressing. OSAT and packaging is available now for qualifying programmes; full-stack fab capability is 2027+. For immediate needs, diversify to Taiwan, South Korea, and Malaysia for device sourcing.

Industrial Motors and Drives – Move with Qualification

Tariff exposure: 25%. India readiness: Medium. India has motor manufacturing capability (Bharat Bijlee, ABB India, Siemens India) but for custom specifications and specialised drive systems, qualification timelines of 6-12 months apply.

The 2026 Tariff-Adjusted TCO Model

Updating the TCO framework for 2026 tariff reality (representative electromechanical assembly, $500K annual spend):

China with 25% Section 301: Direct labour $180K + components $300K + logistics $22K + tariffs $125K + quality $12K = Total $654K

India with 0% tariff: Direct labour $72K + components $330K + logistics $20K + tariffs $0 + quality $10K = Total $450K

India TCO advantage: 31% lower landed cost. For HTS codes with 50%+ tariffs, India’s TCO advantage exceeds 45%.

How to Execute Relocation in 2026: A 90-Day Sprint

Days 1-15: BOM Triage

Pull every China-origin line item. Map each to its HTS code. Apply 2026 tariff schedule. Rank by: (annual China spend x tariff rate) to get dollar tariff exposure per part. This is your relocation priority list.

Days 15-45: Indian Supplier RFQ

For top 20% of tariff exposure (typically 80% of dollar impact), issue simultaneous RFQs to 3-5 Indian suppliers per category. Require: DFM review within 2 weeks, tooling quote within 3 weeks, first article timeline within 60 days of PO.

Days 45-75: Qualification

Run parallel India qualification against existing China production. FAI sign-off required before volume transfer. Do not cut China production until India qualification is complete and buffer stock covers lead time gap.

Days 75-90: Volume Transfer Plan

Commit volume transfer schedule. Build 8-12 weeks of India safety stock. Notify China suppliers of volume reduction with contractual notice period. Begin localising BOM where India-sourced components are available.

Key Takeaways

  • The 2026 tariff escalation has made China-origin sourcing economically indefensible for electronics, forgings, castings, precision machining, and wire harnesses.
  • India is the primary beneficiary: zero tariff exposure, established supplier ecosystem, and PLI-backed manufacturing investment.
  • The TCO advantage of India over China for tariff-exposed categories ranges from 25% to 45% on total landed cost.
  • The highest-readiness categories for immediate India sourcing are: EMS/electronics assembly, wire harnesses, forgings, castings, and precision machining.
  • A structured 90-day sprint can move the highest-tariff-exposure items to India qualification without production disruption.

FAQ

Q: Are the 2026 tariffs permanent or could they reverse?

A: The bipartisan consensus in the US on China trade policy makes full tariff reversal unlikely in any near-term scenario. Supply chain decisions made for 2026 should assume at least 3-5 year tariff persistence. The optionality cost of not diversifying – measured in tariff dollars paid – is higher than the qualification cost of India sourcing.

Q: Which Indian states offer the best incentives for manufacturing relocation investment?

A: Tamil Nadu (electronics, automotive), Gujarat (chemicals, semiconductors, EV batteries), Maharashtra (precision engineering, automotive), and Karnataka (aerospace, electronics) have the most active state-level incentive programmes in 2026, including land subsidies, power tariff concessions, and employment generation incentives layered on top of central PLI.

Q: How quickly can Indian suppliers be qualified for aerospace-grade components?

A: For AS9100-certified Indian suppliers with existing aerospace customer references, qualification timelines of 6-12 months are achievable for new Tier-2 components. First article inspection (FAI) and production part approval process (PPAP) are the primary timeline drivers.

Q: What about intellectual property risk in India vs China?

A: India is a common-law jurisdiction with robust IP protection mechanisms, a functioning court system for IP disputes, and TRIPS-compliant patent law. India’s IP risk profile is significantly lower than China for precision manufacturing, electronics, and pharmaceutical programmes.

Supply Chain Resilience: 10 Proven Strategies for Manufacturers in 2026

In 2021, a single semiconductor fabrication plant shortage grounded automotive production lines worldwide. In 2022, Shanghai lockdowns halted container shipping for weeks. In 2024, Red Sea disruptions added 10–14 days to Europe-Asia freight routes. In each case, the manufacturers who survived with the least damage were not the ones with the most efficient supply chains – they were the ones with the most resilient ones.

Supply chain resilience is no longer a nice-to-have in manufacturing strategy. It is the operating capability that determines whether disruption becomes a competitive advantage or an existential crisis.

What Is Supply Chain Resilience – and Why It Matters More Than Ever

Supply chain resilience is a supply chain’s capacity to anticipate disruptions, absorb them, and recover rapidly to normal performance – or, where possible, improve in the aftermath.

Resilience vs. Efficiency: The Trade-off Manufacturers Must Manage

Lean manufacturing and just-in-time supply chains optimise for efficiency: minimum inventory, minimum redundancy, maximum throughput. This efficiency comes at the cost of resilience. A supply chain with zero buffer inventory and a single source for every component is efficient – until a disruption hits, at which point it is fragile.

The question is not whether to be efficient or resilient – it is where to carry the resilience investment. The answer depends on the criticality of the component, the volatility of the supply base, and the cost of a production stoppage.

The Cost of Getting It Wrong: COVID-19, the Chip Shortage, and Beyond

The automotive semiconductor shortage of 2021 cost the global automotive industry an estimated USD 210 billion in lost revenue. Companies that had dual-source agreements or modest safety stock for critical semiconductors were back in production months before those that had single-sourced to minimise procurement cost.

Resilience investment looks expensive until it is the only thing keeping your production line running.

The 4-Step Resilience Framework

Step 1 – Map and Identify Vulnerabilities

You cannot manage risks you cannot see. Supply chain mapping – identifying every supplier at Tier 1, Tier 2, and Tier 3 – reveals concentration risks, geographic dependencies, and single-source vulnerabilities. For most manufacturers, this mapping exercise reveals surprises: multiple tier-1 suppliers drawing from a common tier-2 source, creating a hidden single point of failure.

Step 2 – Assess Probability and Impact

Not all risks are equal. A risk matrix scoring each vulnerability on probability of occurrence and operational impact allows you to prioritise investment. Focus mitigation investment on high-probability/high-impact risks first.

Step 3 – Build Mitigation Levers

For each priority risk, identify and implement the appropriate mitigation lever – dual sourcing, safety stock, geographic diversification, contract clauses, digital visibility. Not every risk requires the same response.

Step 4 – Monitor and Test Continuously

Supply chains are dynamic. New suppliers are added, volumes shift, geopolitical situations evolve. Resilience requires ongoing monitoring through supplier scorecards, early warning indicators, and periodic scenario planning – not a one-time assessment.

Strategy 1: Supplier Diversification

Single-source dependencies are the most common and most damaging supply chain vulnerability. The mitigation is straightforward: for critical components, qualify at least two sources.

Multi-Sourcing Critical Components

Dual-source qualification requires upfront investment: a second tooling set, a second PPAP, a second ongoing qualification relationship. The return on that investment is paid back in the first disruption event – typically within 12–18 months of implementation.

Tier-2 and Tier-3 Supplier Visibility

Many manufacturers know their tier-1 suppliers well and their tier-2 and tier-3 suppliers barely at all. This is where most disruptions originate. Extending visibility to sub-tier suppliers – through supplier questionnaires, platform data, or third-party risk intelligence – is an emerging best practice.

Geographic Diversification (China+1, India, Vietnam, Mexico)

Concentrating production in a single geography creates geopolitical and regulatory risk that is independent of individual supplier capability. The China+1 strategy – maintaining Chinese production while qualifying a second geography – is the dominant approach for global manufacturers.

Strategy 2: Buffer Inventory and Safety Stock

Just-in-time is efficient. Just-in-case is resilient. The right approach depends on the component’s criticality and supply volatility.

How Much Buffer Is Enough?

Safety stock is a function of demand variability, supply lead time, and acceptable stockout probability. For critical components with long or volatile lead times, 8–12 weeks of safety stock is not unreasonable. For standard commodity components with multiple qualified sources, 2–4 weeks may be sufficient.

Strategic vs. Tactical Inventory Positioning

Strategic inventory – held at a central location to serve multiple programmes – is more efficient than tactical inventory held at individual production sites. Platform-based manufacturing providers like Zetwerk maintain strategic component inventory under vendor-managed inventory programmes, delivering JIT to the customer’s pull signal while carrying the buffer themselves.

Strategy 3: Digital Supply Chain Visibility

What you cannot see, you cannot manage. Real-time visibility into production status, inventory levels, logistics position, and supplier performance is the foundation of proactive disruption management.

Real-Time Order and Production Tracking

Manufacturing platforms provide real-time production milestone tracking – you know whether your order is on time before your production line finds out it isn’t. This early warning gives you time to activate contingency plans.

Early Warning Systems for Disruptions

AI-powered supply chain risk platforms monitor news, logistics data, geopolitical indicators, and supplier financial signals to identify emerging disruptions before they reach your supply chain. The window between early warning and operational impact is when remediation is cheapest.

AI-Powered Demand Forecasting

Machine learning applied to order history, market signals, and external data delivers demand forecasts with lower error rates than manual processes. Better forecasts drive better inventory positioning – reducing both stockout risk and excess inventory cost.

Strategy 4: Nearshoring and Reshoring

Geographic concentration in distant, low-cost manufacturing locations optimises for unit cost at the expense of supply chain speed, resilience, and tariff risk.

The Geopolitical Case for Regional Supply Chains

US tariffs on Chinese imports, European supply chain regulations requiring traceability and sustainability compliance, and the post-COVID reassessment of supply chain fragility have collectively made the business case for regional supply chains more compelling than at any point in the last 30 years.

India as a Resilience-Building Location

India offers a compelling combination for manufacturers seeking supply chain resilience: cost competitive with China (USD 3/hr vs. USD 5.80), geopolitically aligned with Western markets (no tariff risk), English-speaking engineering workforce, PLI incentives, and a broad manufacturing ecosystem spanning electronics, precision engineering, capital goods, and aerospace.

For manufacturers moving from China+0 to China+1, India is the most frequent choice – particularly for electronics EMS, precision components, and capital goods manufacturing.

Strategy 5: Supplier Relationship and Development

The suppliers who will go the extra distance for you during a disruption – prioritise your orders, air-freight to meet a deadline, escalate their own supply chain on your behalf – are the ones with whom you have built genuine relationships.

Preferred Supplier Programmes

Preferred supplier status – awarded based on quality, delivery, and commercial performance – comes with benefits for the supplier (volume commitment, payment terms, technical support) in exchange for priority treatment in constrained conditions.

Joint Business Planning for Capacity Security

Annual joint business planning between OEM and key CM partners – sharing demand forecasts, product roadmaps, and investment plans – allows suppliers to secure long-lead-time capacity and raw material commitments that individual purchase orders cannot drive.

Strategy 6: Platform-Based Multi-Supplier Orchestration

The conventional CM model – bilateral relationships with individual suppliers – creates inherent resilience risk: each supplier is a single point of failure. Digital manufacturing platforms change this architecture fundamentally.

How Manufacturing Platforms Eliminate Single Points of Failure

A platform like Zetwerk maintains a network of 5,400+ pre-qualified suppliers across processes, capabilities, and geographies. When a single supplier experiences a disruption, the platform routes production to an alternative qualified supplier – often within days rather than the months a traditional re-qualification would require.

Parallel Execution Across Multiple Qualified Suppliers

For large or critical programmes, platform-based manufacturing enables parallel production across multiple suppliers simultaneously – distributing volume and eliminating concentration risk without the overhead of managing multiple bilateral relationships independently.

Real-Time Quality and Capacity Data at Scale

Platforms provide aggregated, real-time data on supplier capacity utilisation, quality performance, and delivery reliability across the entire network – enabling proactive production management rather than reactive crisis management.

Strategy 7: Demand-Driven Manufacturing and Agile Planning

Supply chains that are driven by real demand signals – rather than forecasts built weeks or months in advance – carry less excess inventory and respond faster to demand changes. Sales and operations planning (S&OP) processes that incorporate live demand data, customer order signals, and inventory positions outperform forecast-driven planning in both efficiency and responsiveness.

Strategy 8: Risk-Pooling and Redundant Logistics

Single-lane logistics – a single carrier, a single port, a single route – is as vulnerable as single-source supply. Resilient logistics strategies use multiple carriers, multiple ports of entry, and multiple transport modes for critical shipments.

When primary ocean freight routes are disrupted (Red Sea, Panama Canal), manufacturers with pre-qualified air freight arrangements and alternative routing options maintain delivery performance while single-lane suppliers cannot.

Strategy 9: Contract Clauses That Protect Against Disruption

Commercial contracts with suppliers and customers should include:

  • Force majeure clauses that clearly define what events relieve performance obligations – and which do not
  • SLAs with meaningful remedies for delivery failures, not just escalation procedures
  • Capacity reservation rights for critical programmes, particularly during ramp-up phases
  • Tooling ownership clauses that allow you to move production without paying for re-tooling

Strategy 10: Regular Supply Chain Stress Testing

A supply chain resilience plan that has never been tested is a plan that may not work when needed. Regular stress testing – scenario planning, tabletop exercises, and simulated supplier failure events – identifies gaps in contingency plans and builds the organisational muscle memory to respond effectively.

Measuring Supply Chain Resilience: 6 KPIs to Track

MTTD (Mean Time to Detect) Disruptions

How long between a disruption occurring and your team knowing about it? Shorter MTTD enables earlier response. Benchmark: less than 24 hours for tier-1 supplier events.

Recovery Time Objective (RTO)

How quickly can your supply chain return to normal performance after a disruption? Define RTOs by component criticality – critical parts might require a 48-hour RTO; standard commodity parts might accept 2 weeks.

Supplier Concentration Ratio

What percentage of your supply spend is with your top 3 suppliers? Top geography? Top country? High concentration ratios are a lagging indicator of resilience risk.

Inventory Days of Supply

Days of supply for critical components. Below 2 weeks for long-lead-time critical items is a resilience red flag.

On-Time-In-Full (OTIF) Rate

The percentage of orders delivered complete and on time. OTIF below 95% is a signal of supply chain stress before it becomes a production crisis.

Flexibility Index

Can your supply chain increase output by 20% on 4 weeks’ notice? By 50% on 12 weeks’ notice? Flexibility is a direct measure of resilience that most supply chains cannot answer precisely.

Key Takeaways

  • Supply chain resilience is the capacity to anticipate, absorb, and recover from disruptions – distinct from and complementary to supply chain efficiency
  • The 4-step framework (Map → Assess → Mitigate → Monitor) provides a structured approach to building resilience
  • The 10 strategies – from supplier diversification to stress testing – are not sequential; implement them in priority order based on your risk assessment
  • Platform-based manufacturing (Strategy 6) is a structural resilience improvement unavailable to manufacturers operating purely through bilateral CM relationships
  • India as a supply chain location (Strategy 4) offers a unique combination of cost competitiveness and geopolitical alignment that serves both efficiency and resilience goals simultaneously

FAQ

What is the most important supply chain resilience strategy?
Supplier diversification and digital visibility deliver the highest impact for most manufacturers. But the right answer depends on your specific risk assessment – the 4-step framework helps you identify your highest-priority vulnerabilities.

How much does supply chain resilience cost?
Resilience investment includes safety stock carrying cost, dual-source qualification cost, and technology investment. Most manufacturers find that a 2–5% increase in supply chain operating cost buys resilience that prevents disruptions costing 10–50× that investment.

What is the difference between supply chain resilience and supply chain risk management?
Risk management identifies and mitigates specific risks. Resilience is the broader capability to absorb and recover from disruptions – including unforeseen ones. A resilient supply chain handles events that no risk register predicted.