Supply Chain Resilience: 10 Proven Strategies for Manufacturers in 2026
In 2021, a single semiconductor fabrication plant shortage grounded automotive production lines worldwide. In 2022, Shanghai lockdowns halted container shipping for weeks. In 2024, Red Sea disruptions added 10–14 days to Europe-Asia freight routes. In each case, the manufacturers who survived with the least damage were not the ones with the most efficient supply chains – they were the ones with the most resilient ones.
Supply chain resilience is no longer a nice-to-have in manufacturing strategy. It is the operating capability that determines whether disruption becomes a competitive advantage or an existential crisis.
What Is Supply Chain Resilience – and Why It Matters More Than Ever
Supply chain resilience is a supply chain’s capacity to anticipate disruptions, absorb them, and recover rapidly to normal performance – or, where possible, improve in the aftermath.
Resilience vs. Efficiency: The Trade-off Manufacturers Must Manage
Lean manufacturing and just-in-time supply chains optimise for efficiency: minimum inventory, minimum redundancy, maximum throughput. This efficiency comes at the cost of resilience. A supply chain with zero buffer inventory and a single source for every component is efficient – until a disruption hits, at which point it is fragile.
The question is not whether to be efficient or resilient – it is where to carry the resilience investment. The answer depends on the criticality of the component, the volatility of the supply base, and the cost of a production stoppage.
The Cost of Getting It Wrong: COVID-19, the Chip Shortage, and Beyond
The automotive semiconductor shortage of 2021 cost the global automotive industry an estimated USD 210 billion in lost revenue. Companies that had dual-source agreements or modest safety stock for critical semiconductors were back in production months before those that had single-sourced to minimise procurement cost.
Resilience investment looks expensive until it is the only thing keeping your production line running.
The 4-Step Resilience Framework
Step 1 – Map and Identify Vulnerabilities
You cannot manage risks you cannot see. Supply chain mapping – identifying every supplier at Tier 1, Tier 2, and Tier 3 – reveals concentration risks, geographic dependencies, and single-source vulnerabilities. For most manufacturers, this mapping exercise reveals surprises: multiple tier-1 suppliers drawing from a common tier-2 source, creating a hidden single point of failure.
Step 2 – Assess Probability and Impact
Not all risks are equal. A risk matrix scoring each vulnerability on probability of occurrence and operational impact allows you to prioritise investment. Focus mitigation investment on high-probability/high-impact risks first.
Step 3 – Build Mitigation Levers
For each priority risk, identify and implement the appropriate mitigation lever – dual sourcing, safety stock, geographic diversification, contract clauses, digital visibility. Not every risk requires the same response.
Step 4 – Monitor and Test Continuously
Supply chains are dynamic. New suppliers are added, volumes shift, geopolitical situations evolve. Resilience requires ongoing monitoring through supplier scorecards, early warning indicators, and periodic scenario planning – not a one-time assessment.
Strategy 1: Supplier Diversification
Single-source dependencies are the most common and most damaging supply chain vulnerability. The mitigation is straightforward: for critical components, qualify at least two sources.
Multi-Sourcing Critical Components
Dual-source qualification requires upfront investment: a second tooling set, a second PPAP, a second ongoing qualification relationship. The return on that investment is paid back in the first disruption event – typically within 12–18 months of implementation.
Tier-2 and Tier-3 Supplier Visibility
Many manufacturers know their tier-1 suppliers well and their tier-2 and tier-3 suppliers barely at all. This is where most disruptions originate. Extending visibility to sub-tier suppliers – through supplier questionnaires, platform data, or third-party risk intelligence – is an emerging best practice.
Geographic Diversification (China+1, India, Vietnam, Mexico)
Concentrating production in a single geography creates geopolitical and regulatory risk that is independent of individual supplier capability. The China+1 strategy – maintaining Chinese production while qualifying a second geography – is the dominant approach for global manufacturers.
Strategy 2: Buffer Inventory and Safety Stock
Just-in-time is efficient. Just-in-case is resilient. The right approach depends on the component’s criticality and supply volatility.
How Much Buffer Is Enough?
Safety stock is a function of demand variability, supply lead time, and acceptable stockout probability. For critical components with long or volatile lead times, 8–12 weeks of safety stock is not unreasonable. For standard commodity components with multiple qualified sources, 2–4 weeks may be sufficient.
Strategic vs. Tactical Inventory Positioning
Strategic inventory – held at a central location to serve multiple programmes – is more efficient than tactical inventory held at individual production sites. Platform-based manufacturing providers like Zetwerk maintain strategic component inventory under vendor-managed inventory programmes, delivering JIT to the customer’s pull signal while carrying the buffer themselves.
Strategy 3: Digital Supply Chain Visibility
What you cannot see, you cannot manage. Real-time visibility into production status, inventory levels, logistics position, and supplier performance is the foundation of proactive disruption management.
Real-Time Order and Production Tracking
Manufacturing platforms provide real-time production milestone tracking – you know whether your order is on time before your production line finds out it isn’t. This early warning gives you time to activate contingency plans.
Early Warning Systems for Disruptions
AI-powered supply chain risk platforms monitor news, logistics data, geopolitical indicators, and supplier financial signals to identify emerging disruptions before they reach your supply chain. The window between early warning and operational impact is when remediation is cheapest.
AI-Powered Demand Forecasting
Machine learning applied to order history, market signals, and external data delivers demand forecasts with lower error rates than manual processes. Better forecasts drive better inventory positioning – reducing both stockout risk and excess inventory cost.
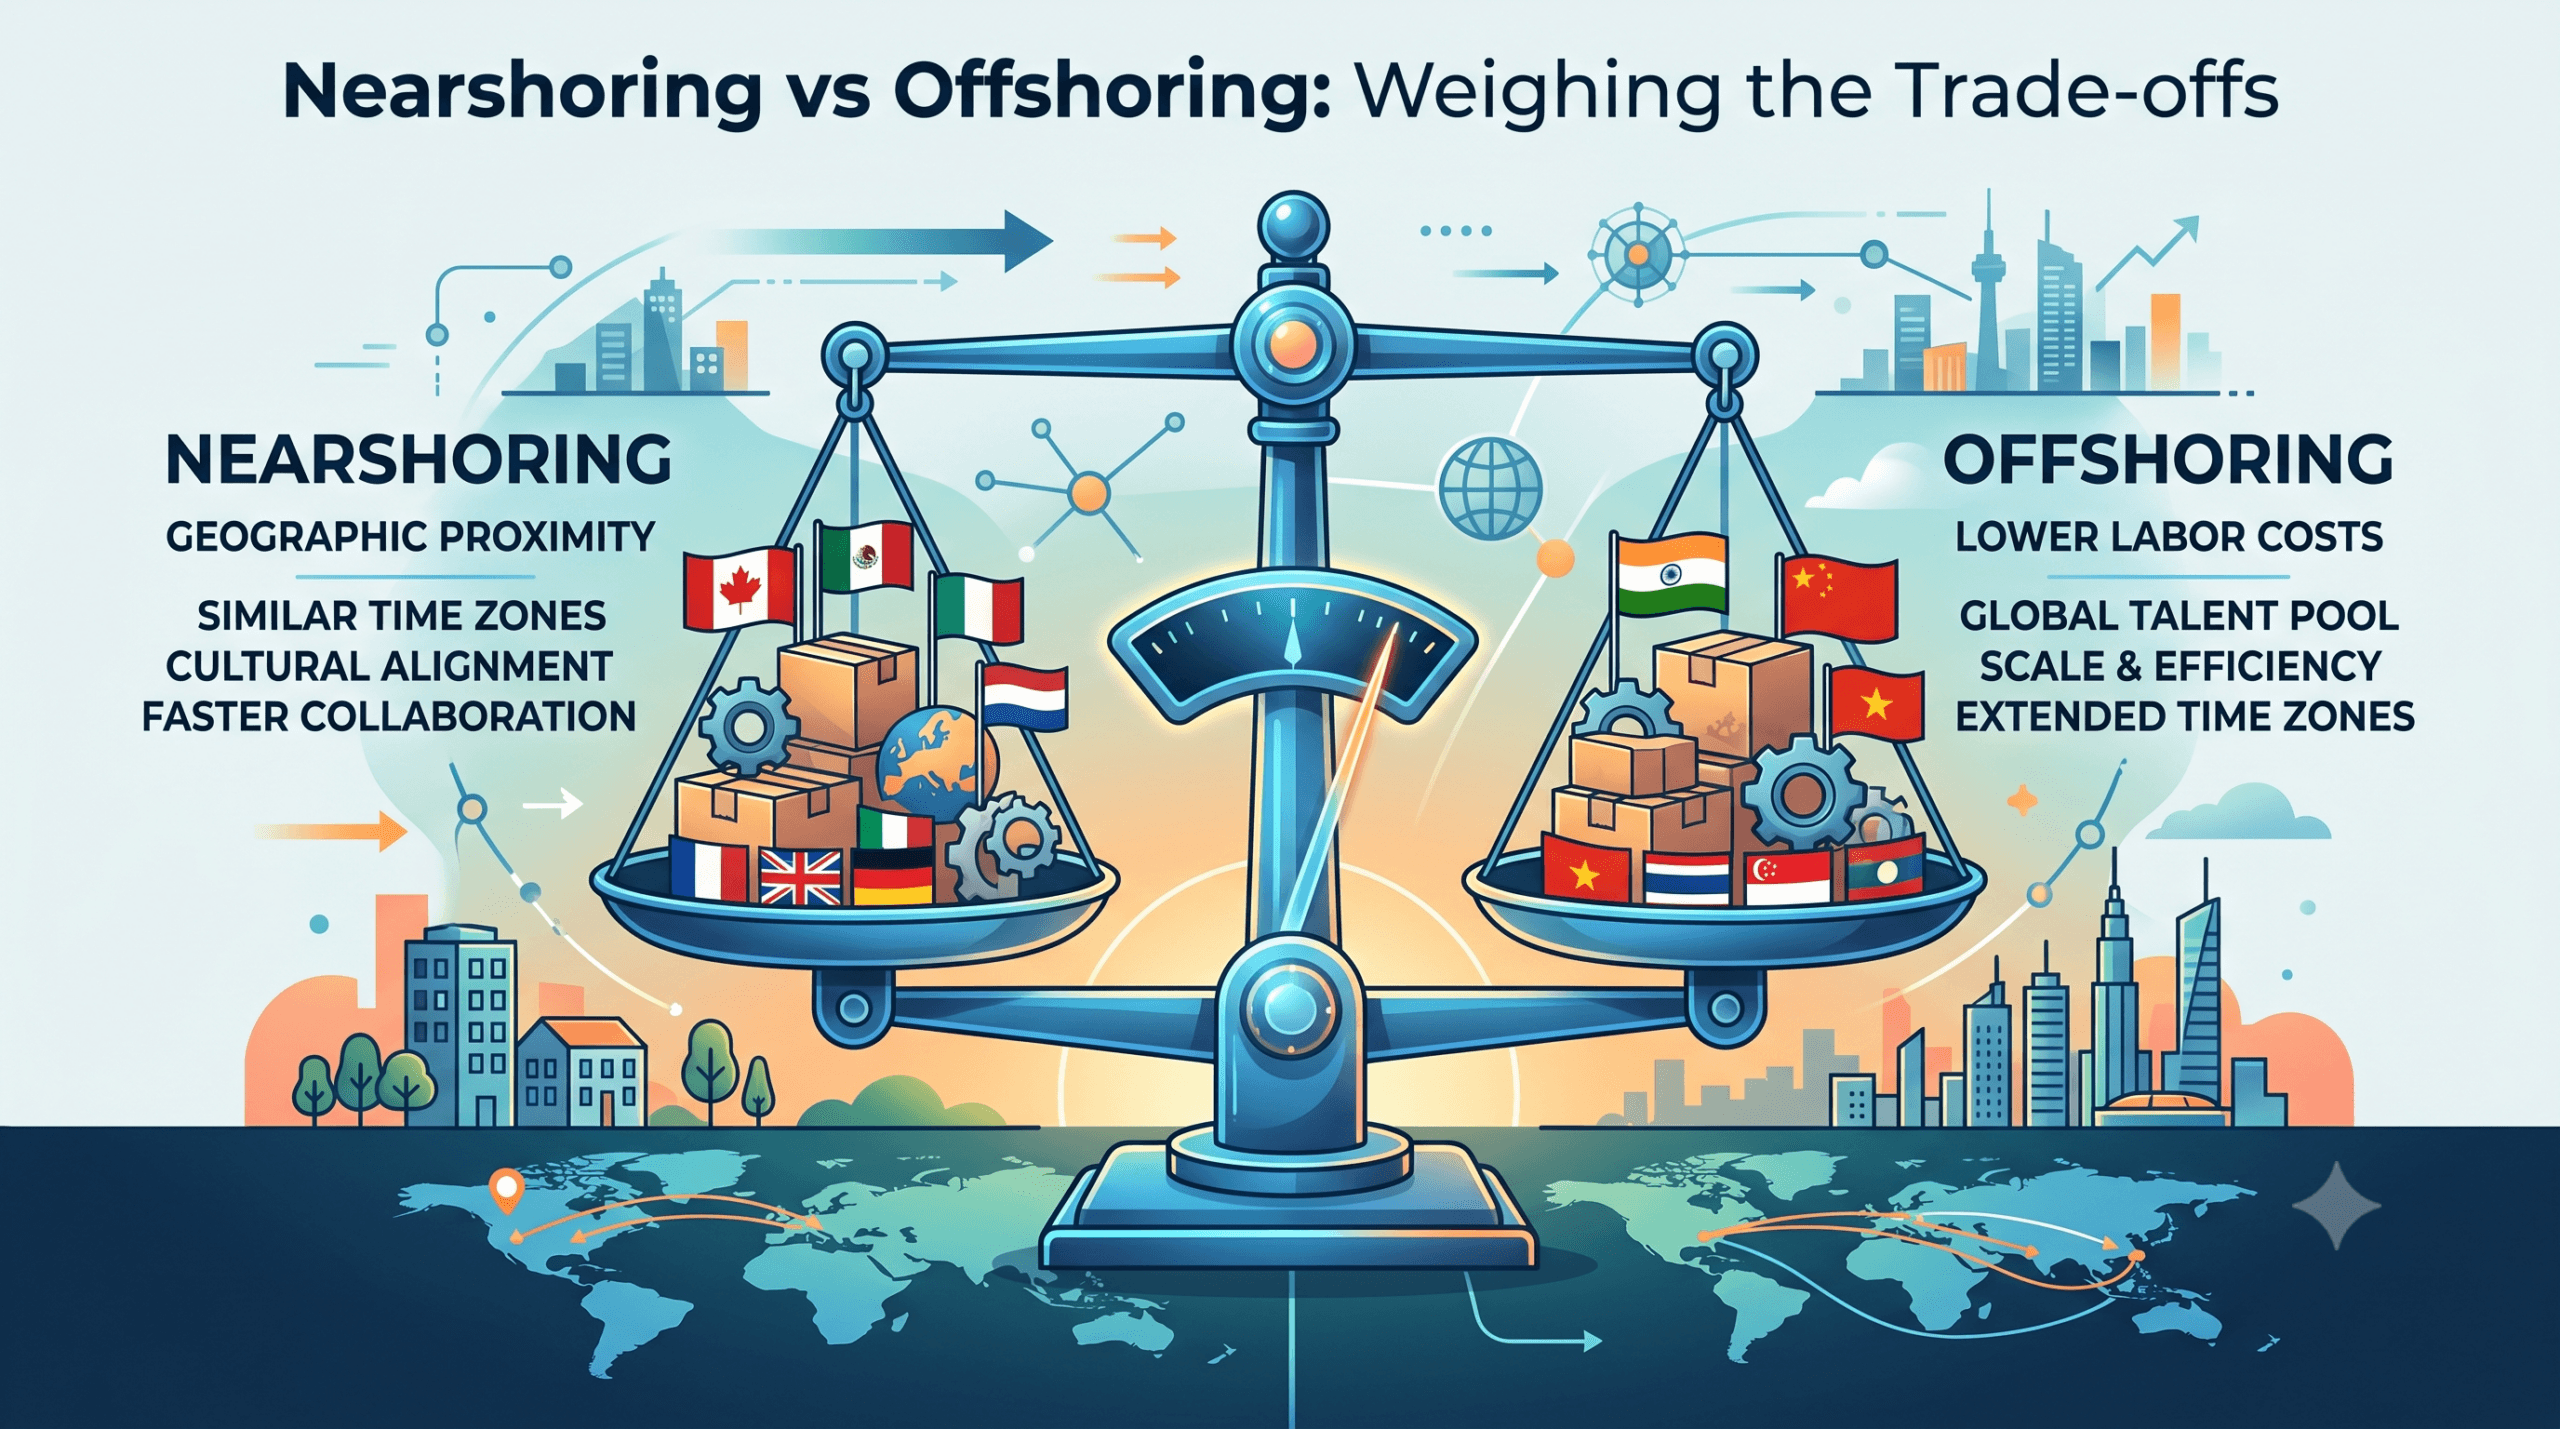
Strategy 4: Nearshoring and Reshoring
Geographic concentration in distant, low-cost manufacturing locations optimises for unit cost at the expense of supply chain speed, resilience, and tariff risk.
The Geopolitical Case for Regional Supply Chains
US tariffs on Chinese imports, European supply chain regulations requiring traceability and sustainability compliance, and the post-COVID reassessment of supply chain fragility have collectively made the business case for regional supply chains more compelling than at any point in the last 30 years.
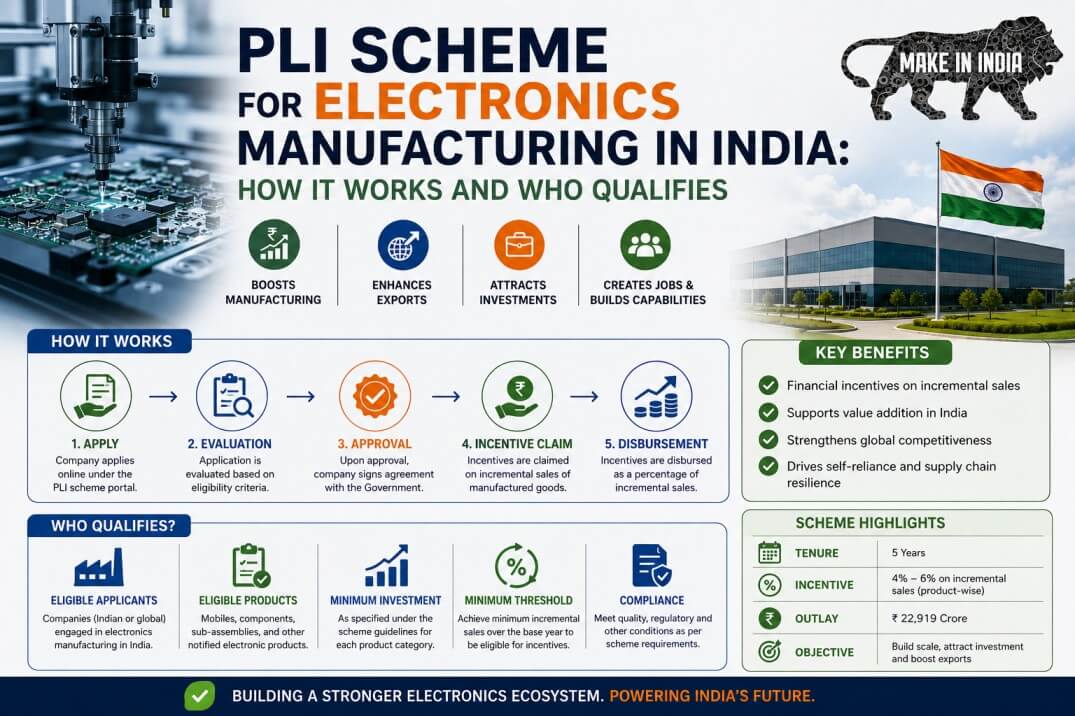
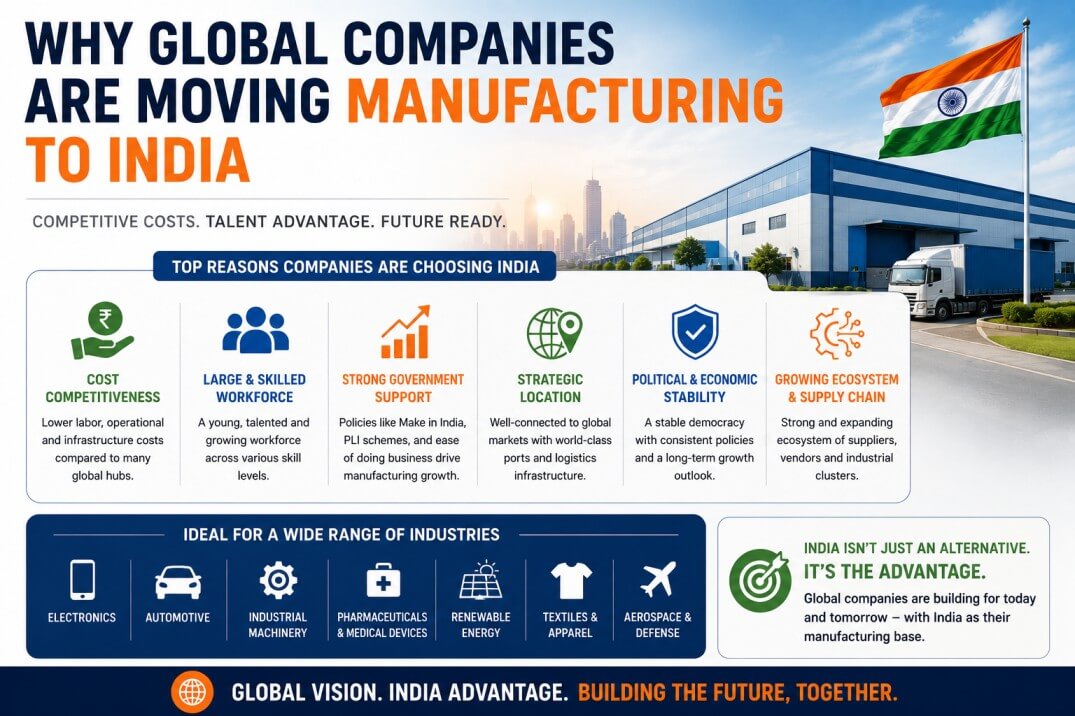
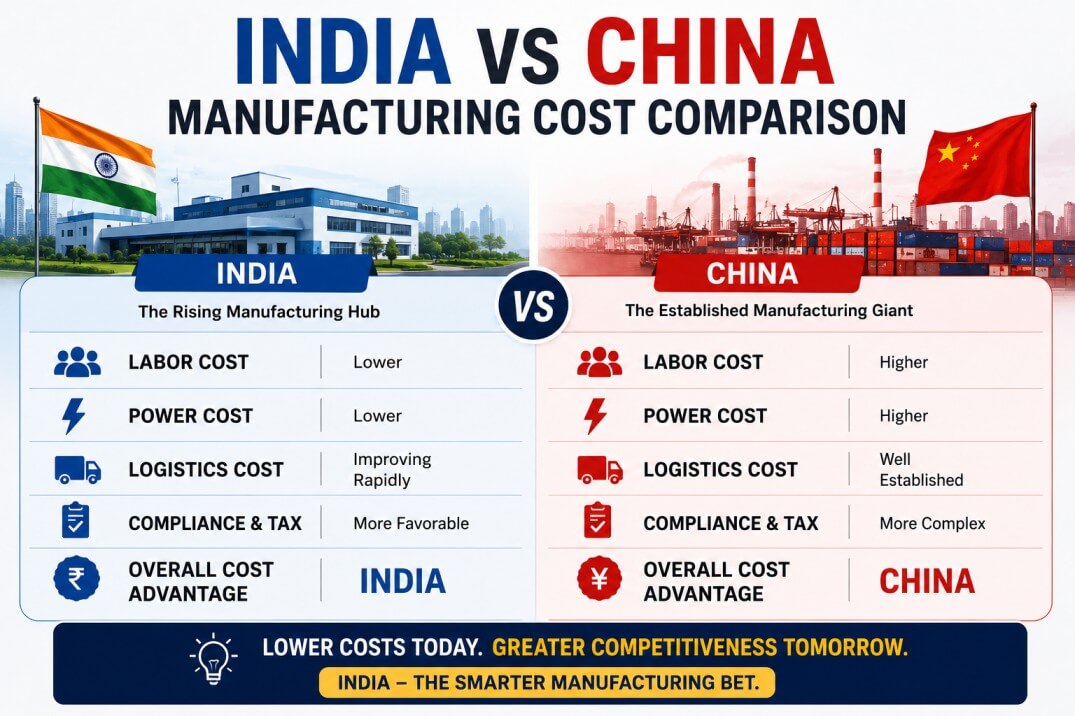
India as a Resilience-Building Location
India offers a compelling combination for manufacturers seeking supply chain resilience: cost competitive with China (USD 3/hr vs. USD 5.80), geopolitically aligned with Western markets (no tariff risk), English-speaking engineering workforce, PLI incentives, and a broad manufacturing ecosystem spanning electronics, precision engineering, capital goods, and aerospace.
For manufacturers moving from China+0 to China+1, India is the most frequent choice – particularly for electronics EMS, precision components, and capital goods manufacturing.
Strategy 5: Supplier Relationship and Development
The suppliers who will go the extra distance for you during a disruption – prioritise your orders, air-freight to meet a deadline, escalate their own supply chain on your behalf – are the ones with whom you have built genuine relationships.
Preferred Supplier Programmes
Preferred supplier status – awarded based on quality, delivery, and commercial performance – comes with benefits for the supplier (volume commitment, payment terms, technical support) in exchange for priority treatment in constrained conditions.
Joint Business Planning for Capacity Security
Annual joint business planning between OEM and key CM partners – sharing demand forecasts, product roadmaps, and investment plans – allows suppliers to secure long-lead-time capacity and raw material commitments that individual purchase orders cannot drive.
Strategy 6: Platform-Based Multi-Supplier Orchestration
The conventional CM model – bilateral relationships with individual suppliers – creates inherent resilience risk: each supplier is a single point of failure. Digital manufacturing platforms change this architecture fundamentally.
How Manufacturing Platforms Eliminate Single Points of Failure
A platform like Zetwerk maintains a network of 5,400+ pre-qualified suppliers across processes, capabilities, and geographies. When a single supplier experiences a disruption, the platform routes production to an alternative qualified supplier – often within days rather than the months a traditional re-qualification would require.
Parallel Execution Across Multiple Qualified Suppliers
For large or critical programmes, platform-based manufacturing enables parallel production across multiple suppliers simultaneously – distributing volume and eliminating concentration risk without the overhead of managing multiple bilateral relationships independently.
Real-Time Quality and Capacity Data at Scale
Platforms provide aggregated, real-time data on supplier capacity utilisation, quality performance, and delivery reliability across the entire network – enabling proactive production management rather than reactive crisis management.
Strategy 7: Demand-Driven Manufacturing and Agile Planning
Supply chains that are driven by real demand signals – rather than forecasts built weeks or months in advance – carry less excess inventory and respond faster to demand changes. Sales and operations planning (S&OP) processes that incorporate live demand data, customer order signals, and inventory positions outperform forecast-driven planning in both efficiency and responsiveness.
Strategy 8: Risk-Pooling and Redundant Logistics
Single-lane logistics – a single carrier, a single port, a single route – is as vulnerable as single-source supply. Resilient logistics strategies use multiple carriers, multiple ports of entry, and multiple transport modes for critical shipments.
When primary ocean freight routes are disrupted (Red Sea, Panama Canal), manufacturers with pre-qualified air freight arrangements and alternative routing options maintain delivery performance while single-lane suppliers cannot.
Strategy 9: Contract Clauses That Protect Against Disruption
Commercial contracts with suppliers and customers should include:
- Force majeure clauses that clearly define what events relieve performance obligations – and which do not
- SLAs with meaningful remedies for delivery failures, not just escalation procedures
- Capacity reservation rights for critical programmes, particularly during ramp-up phases
- Tooling ownership clauses that allow you to move production without paying for re-tooling
Strategy 10: Regular Supply Chain Stress Testing
A supply chain resilience plan that has never been tested is a plan that may not work when needed. Regular stress testing – scenario planning, tabletop exercises, and simulated supplier failure events – identifies gaps in contingency plans and builds the organisational muscle memory to respond effectively.
Measuring Supply Chain Resilience: 6 KPIs to Track
MTTD (Mean Time to Detect) Disruptions
How long between a disruption occurring and your team knowing about it? Shorter MTTD enables earlier response. Benchmark: less than 24 hours for tier-1 supplier events.
Recovery Time Objective (RTO)
How quickly can your supply chain return to normal performance after a disruption? Define RTOs by component criticality – critical parts might require a 48-hour RTO; standard commodity parts might accept 2 weeks.
Supplier Concentration Ratio
What percentage of your supply spend is with your top 3 suppliers? Top geography? Top country? High concentration ratios are a lagging indicator of resilience risk.
Inventory Days of Supply
Days of supply for critical components. Below 2 weeks for long-lead-time critical items is a resilience red flag.
On-Time-In-Full (OTIF) Rate
The percentage of orders delivered complete and on time. OTIF below 95% is a signal of supply chain stress before it becomes a production crisis.
Flexibility Index
Can your supply chain increase output by 20% on 4 weeks’ notice? By 50% on 12 weeks’ notice? Flexibility is a direct measure of resilience that most supply chains cannot answer precisely.
Key Takeaways
- Supply chain resilience is the capacity to anticipate, absorb, and recover from disruptions – distinct from and complementary to supply chain efficiency
- The 4-step framework (Map → Assess → Mitigate → Monitor) provides a structured approach to building resilience
- The 10 strategies – from supplier diversification to stress testing – are not sequential; implement them in priority order based on your risk assessment
- Platform-based manufacturing (Strategy 6) is a structural resilience improvement unavailable to manufacturers operating purely through bilateral CM relationships
- India as a supply chain location (Strategy 4) offers a unique combination of cost competitiveness and geopolitical alignment that serves both efficiency and resilience goals simultaneously
FAQ
Q. What is the most important supply chain resilience strategy?
Supplier diversification and digital visibility deliver the highest impact for most manufacturers. But the right answer depends on your specific risk assessment – the 4-step framework helps you identify your highest-priority vulnerabilities.
Q. How much does supply chain resilience cost?
Resilience investment includes safety stock carrying cost, dual-source qualification cost, and technology investment. Most manufacturers find that a 2–5% increase in supply chain operating cost buys resilience that prevents disruptions costing 10–50× that investment.
Q. What is the difference between supply chain resilience and supply chain risk management?
Risk management identifies and mitigates specific risks. Resilience is the broader capability to absorb and recover from disruptions – including unforeseen ones. A resilient supply chain handles events that no risk register predicted.